
Engagement Rate Metrics: Formulas and Benchmarks for 2026
Engagement rate is a ratio that converts raw interactions into a percentage. Divide interactions by a chosen denominator, such as followers, reach, impressions, or views, then multiply by 100.
That definition sounds simple, but the denominator can change the meaning of the result completely. Historical university benchmarks, for example, reported Facebook engagement between 0.06% and 0.18%, Twitter between 0.04% and 0.07%, and LinkedIn between 0.25% and 0.50%, showing why no percentage is meaningful without its platform and measurement context (academic cross-platform study).
For marketers, this creates a practical risk. A post may appear highly engaging when measured against a small follower base, less engaging when measured against reach, and weaker still when measured against impressions that include repeat exposure. Engagement rate metrics are therefore not one score to optimize blindly. They're a family of diagnostic ratios.
Table of Contents
- Understanding Engagement Rate Metrics and Why Denominator Choice Matters
- Core Formulas for Calculating Engagement Rate
- Historical Benchmarks Across Platforms and Regions
- Platform Differences and Account Size Effects on Engagement
- Step-by-Step Calculation Examples Using Different Denominators
- Using Engagement Metrics in Reporting and Analytics Pipelines
Understanding Engagement Rate Metrics and Why Denominator Choice Matters
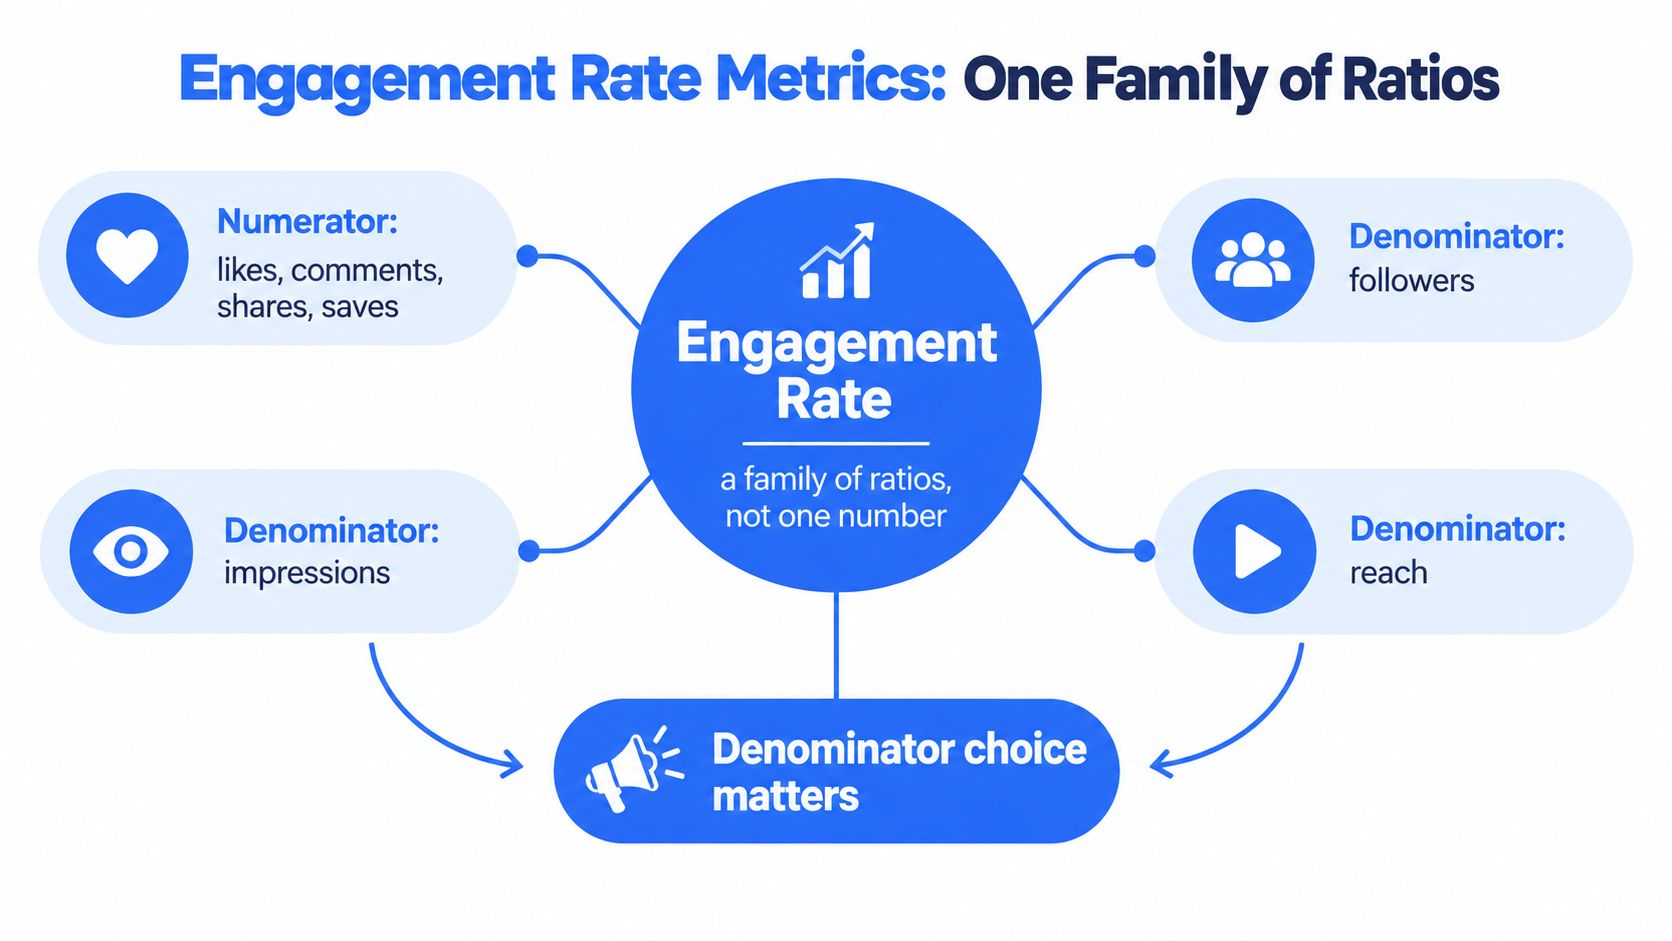
The same post can produce several valid engagement rates because the denominator changes the question. An engagement rate combines a numerator, such as likes, comments, shares, saves, or clicks, with a denominator that represents an audience or exposure base. The formula is simple, but its interpretation depends on the fields selected.
A follower-based rate measures interaction against the account's potential audience. A reach-based rate measures response among people or accounts that encountered the post. An impression-based rate measures interactions against total exposure, including repeat appearances. For video, views or plays provide another exposure base.
One post, several valid interpretations
Hold the post and its interactions constant, then change only the denominator. Followers show audience-base response. Reach shows response among exposed people. Impressions include repeated exposure, so the resulting percentage supports a media-efficiency interpretation rather than a unique-audience interpretation.
The rates can differ sharply without any change in content performance. A dashboard that labels each result merely “engagement rate” hides that variance and makes comparisons unreliable. The denominator is part of the metric definition, not a formatting detail.
The impressions-based formula is post engagements divided by impressions, multiplied by 100, as documented in cross-platform engagement methodology. This distinction affects analytics pipelines: a TikTok video measured against views cannot be compared directly with an Instagram post measured against followers.
Practical rule: Store the numerator components and denominator type alongside every calculated rate.
Each record should preserve the platform, observation date, content format, time window, numerator definition, denominator definition, and raw values. Audience engagement metrics frames this measurement problem directly. Never publish a percentage without retaining the fields that produced it.
Core Formulas for Calculating Engagement Rate
Let E represent the selected engagement actions. For a simple implementation, E might equal likes plus comments plus shares. If saves, clicks, or other actions are included, document that choice in the metric definition.
The four primary formulas are:
Follower-based engagement rate
Follower-based rate = E ÷ followers × 100
This version estimates how actively an account's audience interacts relative to its potential audience. It offers a stable account-level reference, especially when reach data is unavailable, but it doesn't tell you how many followers saw the post.
A small account can produce a high follower-based rate with relatively few interactions. A large account can produce a lower rate despite generating substantially more total activity. The formula is therefore useful for audience-base response, not as a universal measure of content quality.
Reach-based engagement rate
Reach-based rate = E ÷ reach × 100
Reach represents the people or accounts exposed to the content according to the platform's reporting definition. This formula measures response among the audience that encountered the post, making it useful for evaluating content resonance within delivered distribution.
Reach-based measurement still needs careful interpretation. If reach changes because distribution changes, the rate may move even when the creative approach remains similar. Keep reach and engagement counts together so analysts can separate content response from delivery effects.
Impression-based engagement rate
Impression-based rate = E ÷ impressions × 100
Impressions count exposures rather than necessarily unique people. Repeat appearances increase the denominator, which can make the rate lower than a reach-based rate for the same post. That isn't a flaw. It means the metric evaluates interactions against total exposure.
This version is particularly informative when exposure frequency matters, including paid or repeated distribution. It should never be mixed with reach-based rates in the same trend line without clearly labeling the change.
View-based engagement rate
View-based rate = E ÷ views or video plays × 100
For video content, views or plays may be the most available exposure denominator. The metric measures interaction relative to reported video consumption, but teams must record whether views are unique and how the platform defines a play.
A view-based rate can be useful for comparing videos within the same platform and format. It shouldn't be treated as equivalent to a follower-based rate on another platform. For a quick calculation, teams can use an engagement rate calculator, then retain the underlying inputs in their own data store.
For platform-specific interpretation, marketers can also compare Instagram engagement benchmarks, provided they confirm the denominator and interaction definition behind each benchmark.
Historical Benchmarks Across Platforms and Regions
A single benchmark can conceal substantial variance. Historical engagement rates shift with platform, region, publishing frequency, interaction type, and denominator. The same post may produce different rates when its interactions are divided by followers, reach, or impressions, so a benchmark is interpretable only when its calculation context is recorded.
A university-focused study reported an overall mean engagement rate of 0.237 alongside average publishing activity of 7.04 posts per day (university engagement research). The combination indicates that higher posting volume did not automatically generate stronger interaction. It also shows why rate comparisons should retain both numerator and denominator, rather than treating publishing frequency as a proxy for audience response.
Regional variation changes the benchmark
The same study reported Facebook engagement of 1.151 in Latin America, compared with 0.720 in Europe and 0.863 in the United States. These values are reference points for defined populations, not universal performance targets. Geography can shift the baseline before marketers account for creative quality, audience composition, distribution, and denominator choice.
The gap may reflect participation habits, institutional communication styles, content mix, or measurement conditions. The evidence does not isolate one cause, but it does support region as a segmentation field in benchmark datasets. A useful comparison therefore stores platform, region, account type, period, interaction definition, and denominator as separate fields.
A benchmark without platform, region, denominator, and interaction type is a reference number without a reliable interpretation.
Engagement is made of different behaviors
The university research separated engagement into reactions, conversations, and viralization. European universities recorded a general engagement rate of 0.395. North American institutions recorded viralization of 0.028, compared with 0.052 in Europe and 0.051 in Latin America.
This split changes the meaning of the aggregate rate. Reactions may dominate the numerator, while comments represent conversation and shares represent distribution beyond the initial audience. Two posts can share the same total rate while producing different strategic outcomes, especially if one earns discussion and the other generates lightweight reactions.
A benchmark table should preserve these components:
- Reaction rate: likes, reactions, or similar lightweight actions.
- Conversation rate: comments, replies, or discussion signals.
- Distribution rate: shares, reposts, or other amplification actions.
- Composite rate: the documented combination of selected actions.
For competitor analysis, teams should compare equivalent definitions and denominators. Captapi's competitor analysis and benchmarking workflows can support structured collection, while analysts still need to document each field. Historical averages provide directional evidence, not pass-fail thresholds.
Platform Differences and Account Size Effects on Engagement
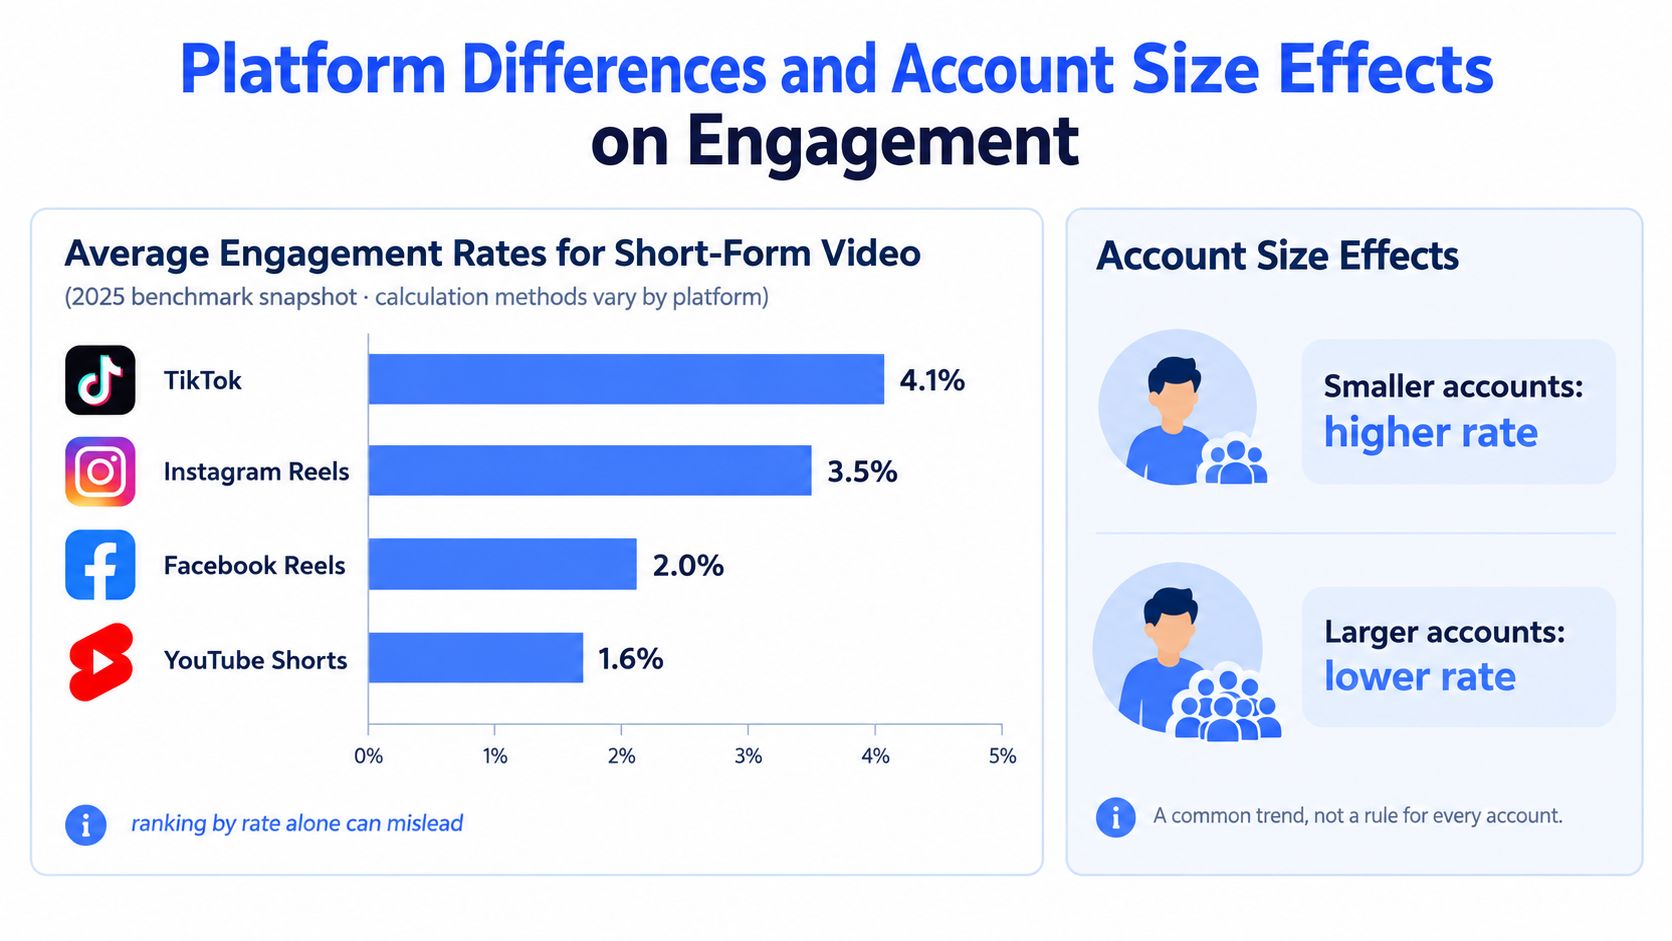
Platform averages become less reliable once distribution and account size enter the calculation. A 2025 analysis of nearly 5.7 million videos from more than 582,000 worldwide accounts found simultaneous declines in engagement, likes, and reach, alongside an 8.24% average engagement rate for one leading platform (short-form video analysis). The reported rate describes one denominator and one platform context, so it cannot represent every account or exposure pattern.
Rate and reach can point in opposite directions
The same benchmark reporting placed TikTok at 5% engagement, Instagram at 3.6%, and YouTube at 3.4%, while Instagram recorded 42% more average reach than TikTok. A ranking based only on engagement rate would therefore favor TikTok, even though Instagram distributed content to more accounts on average.
The denominator determines what the percentage measures. A follower-based rate describes activity against the account's potential audience. A reach-based rate measures interaction among accounts that received the content. An impression-based rate includes repeated exposure, while raw interactions show total activity without normalizing for audience size.
| Question | Useful primary measure |
|---|---|
| Did exposed people interact? | Reach-based or view-based rate |
| How much activity did the post generate? | Raw interactions |
| How broadly did content distribute? | Unique reach |
| How often was content shown? | Impressions and frequency |
| Did the audience take valuable action? | Documented conversion event |
Account size produces heavy-tailed results
Account size can make averages particularly unstable. Benchmark reporting found extreme TikTok volatility, with nano creators exceeding 800% engagement in top-quartile cases, while mega creators often remained below 1.5%. A small denominator can produce a very high ratio even when absolute interaction counts are modest, especially when a post's interactions exceed the measured follower base or when the dataset uses an exposure-based denominator.
Large accounts face the opposite mathematical pressure: the same interaction count represents a smaller percentage against a larger denominator. Account-size comparisons should therefore preserve both the rate and its underlying counts. Medians and percentile bands by segment provide a clearer view than one overall average, particularly for heavy-tailed results.
A useful dashboard links engagement rate with reach, impressions, frequency, shares, completion, and conversions. For systems managing multiple identities or client accounts, scoping accounts for AI agents helps keep records assigned to the correct entity before rates are calculated. That data separation matters because a denominator drawn from the wrong account can create a plausible but invalid result.
Instagram implementations should follow the same rules. The Instagram engagement metrics guide provides a reference for metric definitions, while cross-platform comparisons still require matching numerator and denominator logic.
Step-by-Step Calculation Examples Using Different Denominators
Consider one hypothetical post with 500 likes, 50 comments, and 20 shares. The total interaction count is:
E = 500 + 50 + 20 = 570 interactions
The interactions stay fixed. Only the denominator changes.
Follower-based calculation
Assume the account has 10,000 followers at the observation date.
570 ÷ 10,000 × 100 = 5.7%
This result describes interaction relative to the account's potential audience. It doesn't establish that every follower saw the post, so it shouldn't be read as a response rate among exposed people.
Reach-based calculation
Assume the post reached 2,000 accounts.
570 ÷ 2,000 × 100 = 28.5%
The percentage is much higher because reach is smaller than the follower base in this example. It answers a different question: how intensely did the reached audience interact?
Impression-based calculation
Assume the post generated 4,000 impressions.
570 ÷ 4,000 × 100 = 14.25%
This denominator includes repeated exposure. The rate is lower than the reach-based result because the post accumulated more impressions than reached accounts. That difference can reveal exposure frequency, but it doesn't tell you whether repeat viewers were unique individuals.
View-based calculation
Assume the post is a video with 8,000 views.
570 ÷ 8,000 × 100 = 7.125%
This version evaluates interactions relative to reported plays. It's useful only if the team defines what counts as a view and applies the same rule to comparable videos.
The arithmetic is straightforward. The interpretation isn't. A marketer might use the follower-based rate to monitor audience-base response, the reach-based rate to evaluate content quality, the impression-based rate to assess exposure efficiency, and the view-based rate to compare video interaction against plays. Combining them into one unlabeled trend would destroy that distinction.
Use an Instagram engagement rate calculator for quick validation, but store the inputs, denominator label, platform, format, and observation date beside the output.
Using Engagement Metrics in Reporting and Analytics Pipelines
A reliable pipeline stores raw interactions before it stores normalized rates. Preserve likes, comments, shares, saves, views, reach, impressions, and follower counts where available. Then calculate multiple rates downstream so analysts can select the denominator that matches the business question.

A useful event record should identify the account, platform, content ID, content format, observation date, numerator components, denominator type, denominator value, and calculation version. This prevents a reporting change from masquerading as a performance change.
The strongest default is to report at least two views: reach-based rate for content quality and follower-based rate for audience-base response and account growth. Add impression- or view-based rates when repeat exposure or video consumption is central to the question. The supporting analysis on engagement-rate interpretation reinforces the key limitation: a high rate can reflect intense interaction within a narrow audience while contributing little incremental reach or commercial value.
That principle also applies when engagement data feeds broader workflows. Teams connecting social signals to sales engagement workflows for B2B teams should avoid treating a social interaction rate as a conversion proxy. Keep the social metric and the downstream business event separate, then test whether the relationship holds for the relevant audience and time window.
Captapi offers a developer-first Social Media Data API that returns normalized metrics such as views, likes, comments, interactions, and engagement rate for supported YouTube, TikTok, Instagram, and Facebook URLs. Its documented engagement-rate basis is interactions divided by views when both values are available, so teams should preserve that denominator when comparing its output with follower-, reach-, or impression-based calculations.
Treat the percentage as a diagnostic lens, not a verdict. A defensible dashboard makes the denominator visible, keeps raw data available, segments by platform and account size, and connects engagement with distribution and business outcomes.
Build denominator-aware social reporting with Captapi's cross-platform API, preserving raw interactions and the inputs behind every engagement-rate calculation. Visit Captapi to explore its unified data endpoints for YouTube, TikTok, Instagram, and Facebook.