
Competitor Analysis and Benchmarking Guide for 2026

Your marketing team spends weeks building a competitor scorecard. The deck reaches the quarterly review, earns a few nods, and then disappears into a shared drive. Months later, a rival changes its pricing, shifts its content strategy, or starts appearing everywhere your buyers search. Nobody notices because the benchmark was designed as a presentation, not as a working measurement system.
That distinction sits at the heart of effective competitor analysis and benchmarking. Competitor analysis is the qualitative practice of understanding rivals' products, positioning, pricing, channels, and customer perception. Benchmarking is the quantitative operating loop that measures your performance against a fixed peer set using consistent metrics, sources, definitions, and update cycles. One informs strategic judgment. The other keeps the dashboard and alerts alive.
The practical frameworks behind modern benchmarking emphasize a limited metric basket, stable comparisons, normalized values, and scheduled refreshes rather than sprawling scorecards. A structured competitor benchmarking guide recommends tracking only metrics that can be sourced reliably, placing them on a common scale, and refreshing them often enough to reveal change. The following system is designed for teams that want the benchmark to produce decisions, not another abandoned spreadsheet.
Table of Contents
- Why Most Competitor Benchmarks Go Stale Before Lunch
- Choosing the Right Competitor Set
- Picking Metrics You Can Actually Source
- Collecting and Unifying Data From Multiple Platforms
- Normalizing Numbers Into a Comparable View
- Turning the Benchmark Into a Continuous System
- Your 30-Day Competitor Benchmarking Rollout
Why Most Competitor Benchmarks Go Stale Before Lunch
A one-time benchmark fails because the work ends at publication. Analysts collect screenshots, export reports, compare pricing pages, and turn observations into a polished scorecard. Leadership reviews the output, but nobody owns the next collection cycle, the source definitions remain undocumented, and the file has no mechanism for showing what changed.
That creates two different problems. First, the business loses the original context, so a later comparison may use a different time window or a changed peer set. Second, teams start treating old observations as current facts. A competitor analysis deck can still describe what a rival did when it was created, but it can't tell you whether that rival has since altered its product messaging or customer experience.
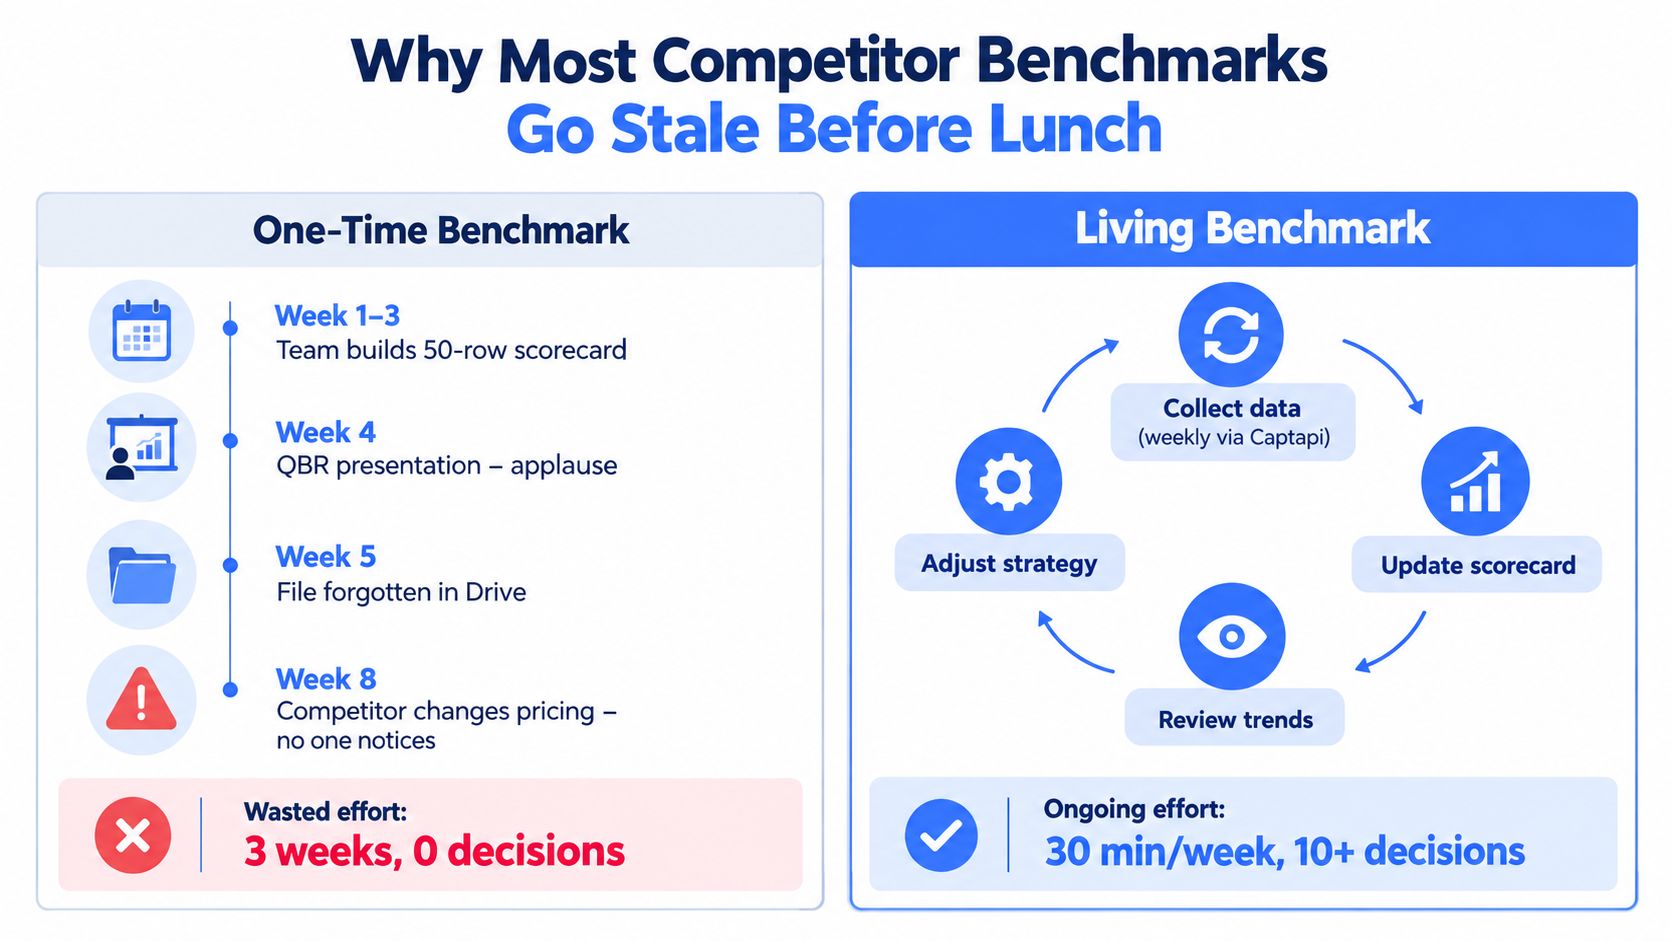
Separate observation from measurement
Use competitor analysis for questions that require interpretation:
- Positioning: What promise does each rival lead with, and which buyer problem does it emphasize?
- Offer structure: How do packaging, pricing, proof, and feature access shape the buying decision?
- Customer perception: What do reviews, communities, and public conversations praise or criticize?
- Strategic movement: Which launches, partnerships, campaigns, or category shifts deserve a response?
Use benchmarking for questions that require repeatable comparison:
- Relative visibility: How much of the tracked search, paid, or social conversation does each brand capture?
- Change over time: Is a competitor gaining or losing ground on the same metric?
- Operational gap: Where are we behind the selected leader, and by how much on a comparable scale?
- Action priority: Which movement should change budget, content, product, or sales activity?
Practical rule: If a metric doesn't have a named source, a definition, an owner, and an update cycle, it isn't ready for a benchmark.
A living system starts with a locked peer set, a small group of sourceable metrics, normalized calculations, and an automated ingestion path. The U.S. Census Bureau's benchmark methodology offers a useful principle for this work, align frequent observations to a higher-quality reference while minimizing revisions. In competitor monitoring, that means preserving comparable snapshots instead of rewriting history whenever a source changes.
Choosing the Right Competitor Set
The peer set determines whether the dashboard answers a useful question or produces noise. Start with three to five competitors, then assign every name to one of three roles: direct, aspirational, or adjacent. Practitioner guidance supports a small, stable set with mixed roles because the right comparator depends on the decision you're trying to make, not merely on which brands look similar at first glance.
Direct competitors sell a comparable solution to a similar buyer. A mid-market CRM vendor might compare itself with HubSpot and Pipedrive across feature pages, pricing tables, review activity, and organic visibility. These rivals are appropriate for questions about product parity, conversion friction, and category demand.
Aspirational competitors are larger or more established brands that provide a reference for the standard you want to approach. A Series B startup might track Salesforce for brand presence, share of voice, and review velocity even though Salesforce's primary market includes larger enterprises. The comparison isn't a claim that both businesses have the same operating model. It's a way to study the signals associated with category authority.
Adjacent competitors solve the same job through a different product or workflow. A project management platform should consider an in-house spreadsheet process or a collaboration suite if customers use those substitutes instead of buying dedicated project software.
| Competitor Label | Category | What You Benchmark Against Them | Lock-In Period |
|---|---|---|---|
| HubSpot | Direct | Feature coverage, pricing presentation, search visibility, reviews | At least two quarters |
| Salesforce | Aspirational | Brand visibility, share of voice, review velocity, category authority | At least two quarters |
| Spreadsheet workflow | Adjacent | Collaboration use cases, switching language, customer objections | At least two quarters |
Write the inclusion rule before collecting data
Document the reason for every inclusion in a short memo. Record the target buyer, overlapping job to be done, category role, relevant channels, and the decisions the comparator should inform. Lock the set for at least two quarters unless a genuine market change makes the comparison invalid.
Don't replace a vendor every refresh because a new logo appeared at an event. A moving peer set makes trend lines meaningless and encourages teams to select whichever competitors make the current result look most favorable. If you need discovery, maintain a separate watchlist and promote names into the benchmark only during the scheduled recalibration.
Teams comparing software categories can also use resources such as compare FindClout alternatives to expand discovery, then apply their own inclusion rubric before adding a company to the operating set. For the mechanics of maintaining recurring observations, see competitor monitoring software, but keep the strategic decision about who belongs in the benchmark with the analyst.
Picking Metrics You Can Actually Source
The best scorecard isn't the one with the most rows. It's the one your team can refresh consistently without relying on manual guesses or an unavailable vendor report. Practical benchmarking guidance commonly favors five to eight reliably sourced metrics, each with a named source, a refresh cadence, and a normalization rule.
Build the metric dictionary before opening the dashboard. For every row, write the exact definition, the source URL or system, the collection method, the time window, and the treatment for missing values. This prevents a familiar failure mode, where one analyst counts every social interaction while another counts only comments and shares.
A focused metric basket might include:
- Share of voice: Track organic, paid, and social visibility separately before creating a combined view. A single blended number can hide whether a rival is strong in search but weak in paid creative.
- Pricing-page change frequency: Use page-diff monitoring to record meaningful changes to plans, packaging, limits, and calls to action.
- Review activity: Pull review volume and star ratings from platforms such as G2, Capterra, or Trustpilot, while preserving the platform name and collection date.
- Feature release cadence: Monitor public changelogs and GitHub releases where those sources are relevant and consistently available.
- Customer-facing response time: Observe replies in community forums and public social conversations. Treat private direct-message data cautiously, because access and comparability vary by platform.
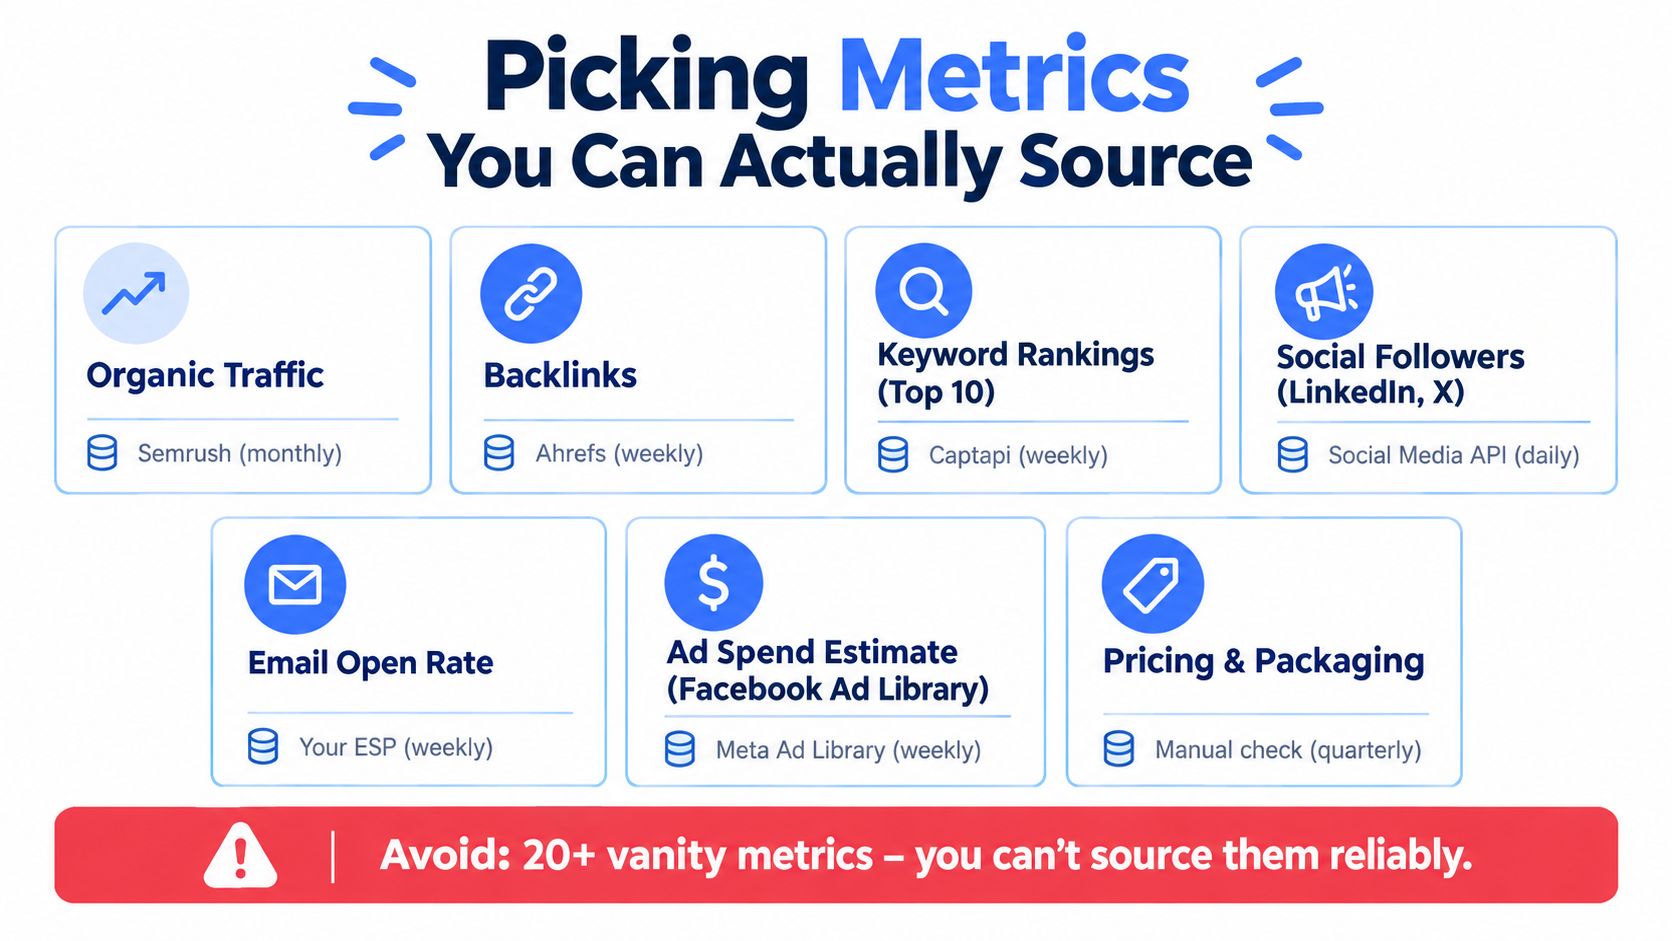
Reject attractive metrics with weak provenance
A one-time sentiment study may help a positioning project, but it doesn't belong in a weekly benchmark if you can't repeat the collection method. The same applies to competitor revenue estimates, private conversion rates, and any metric assembled from inconsistent panels. Label those observations as qualitative context rather than placing them beside measured values.
Raw totals also create misleading comparisons. A large company will usually have more followers, reviews, and impressions than a smaller one because it has greater reach. Prefer rates, per-thousand measures, or percentile ranks where the denominator is available and meaningful. The Typeform guidance on survey data analysis reinforces the importance of preserving consistent wording and sampling context when comparing survey waves. The same discipline applies to competitor metrics, changing the definition midstream invalidates the trend.
Be especially skeptical of estimated ad spend. Estimated impressions don't tell you how often creative rotated, which audience saw it, or whether the ads produced qualified demand. Store estimated spend and observed creative activity as separate fields. The loudest number in a vendor deck is often the least dependable one.
For a practical treatment of engagement definitions, use this guide to social media engagement metrics. It helps keep interaction measures distinct before they enter the comparison model.
Collecting and Unifying Data From Multiple Platforms
A mid-market SaaS team monitoring three rivals usually touches several public and internal streams. Native platform analytics provide owned-account context, third-party social listening tools surface mentions, search and ad libraries reveal public visibility, and review sites or podcast transcripts expose customer language. Each source has different authentication, rate limits, field names, missing-value behavior, and collection boundaries.
Wiring those sources separately looks manageable until the first schema change. One connector returns video_id, another returns post_id, and a third provides engagement as a precomputed score rather than separate reactions and comments. Analysts then spend their time repairing joins instead of interpreting movement.
A unified ingestion layer should standardize the handoff. Captapi can serve as one option for collecting public social data from YouTube, TikTok, Instagram, and Facebook through a consistent REST interface, including transcripts, summaries, comments, engagement metrics, channel or page details, and search results. The point isn't to eliminate source judgment. It's to make the downstream table consistent enough for recurring analysis.
A practical collection sequence
The operating flow is straightforward:
- Define the watchlist: Store competitor handles, channel URLs, page IDs, query clusters, and source-specific exclusions in one configuration file.
- Schedule collection: Run the daily pull at 02:00 UTC, or choose a time that avoids your team's reporting window.
- Land raw records: Write every response to a staging table with the source, request timestamp, competitor, and raw payload.
- Curate warehouse rows: Map approved fields into a stable schema, then calculate derived metrics in a separate transformation layer.
- Record failures: Keep an error table that distinguishes authentication problems, empty results, rate limits, and source changes.
| Source channel | Captapi endpoint | Sample fields returned |
|---|---|---|
| Public video and social pages | Platform search or channel and page endpoints | Platform, post ID, title, published time, views, reactions, comments |
| Video conversations | Transcript and summary endpoints | Transcript ID, transcript text, summary, language |
| Public comments | Comment endpoints | Post ID, comment text, author handle, published time, engagement |
| Cross-platform discovery | Search endpoints | Query, platform, result URL, competitor, result position |
The first script should request only the fields the benchmark uses. For example, select platform, post_id, impressions where available, engagement, transcript_id, and sentiment rather than storing every response field in the reporting table. Keep the raw payload separately for audit and later enrichment.
A useful external reference is this data-led influencer market report, particularly when deciding which public creator and conversation signals deserve a place in the watchlist. For implementation patterns around scheduled pulls, retries, and staging, see data pipeline automation.
The most dangerous failure isn't a visible error. It's a silent gap. If one source drops for several days and the pipeline fills the dashboard with zeros, leadership may interpret missing collection as competitor weakness. Add freshness checks that flag the last successful pull, row count, and source coverage before any normalized value reaches the executive view.
Normalizing Numbers Into a Comparable View
Raw data is not comparative data. A follower total, impression count, review count, or backlink count reflects both performance and scale, so placing those values side by side can reward the largest company rather than reveal the strongest result.
Split the metric basket into two groups. Absolute counts usually need a rate, a denominator, or a percentile treatment. Ratios can often remain as ratios, provided the numerator, denominator, time window, and collection method match across competitors.
For example, raw impressions become more useful when expressed as impressions per post per day. Raw follower growth becomes more interpretable as engagement per 1,000 followers, assuming follower counts are collected for the same period and the denominator is published consistently. The denominator matters as much as the numerator. If one competitor barely publishes follower data, don't manufacture precision by using a weak base.
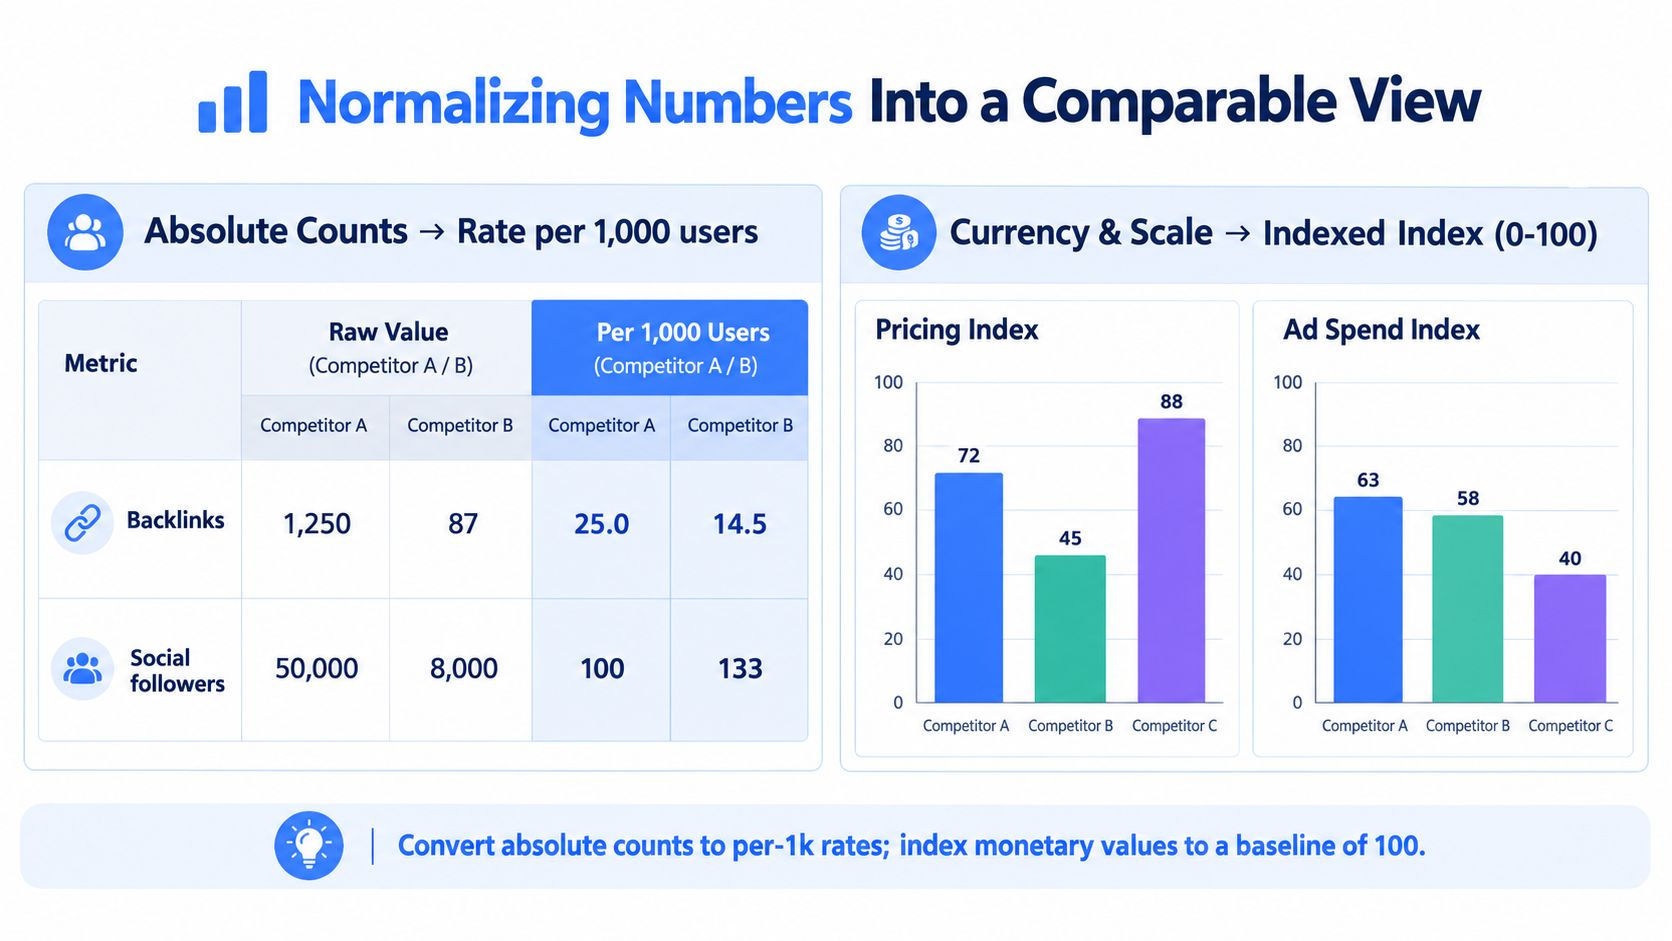
Protect the comparison from false gaps
Three errors damage benchmarking more than imperfect formulas:
- Mismatched windows: Comparing a 90-day internal measure with a 30-day external estimate creates an apparent gap that may reflect timing rather than performance.
- Mixed reach types: Paid and organic reach answer different questions. Keep them separate unless the combined definition is explicitly documented.
- Weak denominators: A rate based on an unreliable or rarely updated base can look precise while carrying little meaning.
Once the inputs align, calculate share of voice within the defined competitor set. For a selected query cluster or channel, use:
Competitor share of voice = competitor visibility units / total visibility units across the peer set
The unit might be tracked ranking presence, observed mentions, or eligible impressions. It must stay consistent across the comparison. Don't present share of voice as total market share unless the data covers the market rather than the selected watchlist.
A second useful view is gap to leader:
Gap to leader = competitor normalized value minus leader normalized value
For metrics where lower is better, reverse the direction and label it clearly. Store the normalized table with the raw-value reference, denominator, time window, source, formula version, and calculation timestamp. Versioning protects historical comparisons when a source changes its definition or a transformation is corrected.
The data transformation techniques guide is useful when designing the staging-to-warehouse layer. Keep raw and normalized tables separate. Analysts should be able to reproduce every dashboard value without overwriting the original collection.
Turning the Benchmark Into a Continuous System
A static audit assumes the market will wait for the next planning cycle. It won't. A benchmark earns its place in the operating rhythm only when somebody receives a signal early enough to act on it.
Set up two layers. The first is automated monitoring, with weekly alerts for material movement in tracked metrics. The second is a monthly recalibration meeting, where the team reviews the peer rationale, retires metrics that no longer produce decisions, checks source health, and refreshes targets.
Define alert logic before the first surprise
Alerts should point to a decision, not merely announce motion. A change in social visibility may require a creative review. A pricing-page edit may require a packaging response. A release burst may require product marketing to update comparison pages or sales enablement.
Force an out-of-cycle rerun when:
- A rival launches a meaningful product change: Revisit feature pages, messaging, search visibility, and customer response.
- A competitor changes pricing or packaging: Capture the page diff, effective date, and affected plans before interpreting the move.
- The category experiences an algorithm shift: Recheck organic or platform-specific metrics because the measurement environment may have changed.
- Share of voice moves sharply: Treat a sudden 20 percent swing as an escalation trigger, as specified in the rollout policy, and verify the underlying source before acting. The 2026 SEO competitor benchmarking guidance discusses continuous, page-level monitoring and the value of recurring recalibration.
The pipeline should make these changes configurable. Add a competitor to the watchlist, change a query cluster, or adjust an alert threshold through parameters rather than a new engineering project. The dashboard itself needs only a few durable views: current rank, trend, gap to leader, source freshness, and a linked action owner.
For the reporting layer, reporting automation provides implementation context. Every chart should answer where the number came from, when it was collected, how it was normalized, and who acts when it moves.
Your 30-Day Competitor Benchmarking Rollout
A working benchmark doesn't require a giant transformation program. It needs a constrained first release, clear exit criteria, and enough historical context to separate a meaningful shift from a noisy observation.
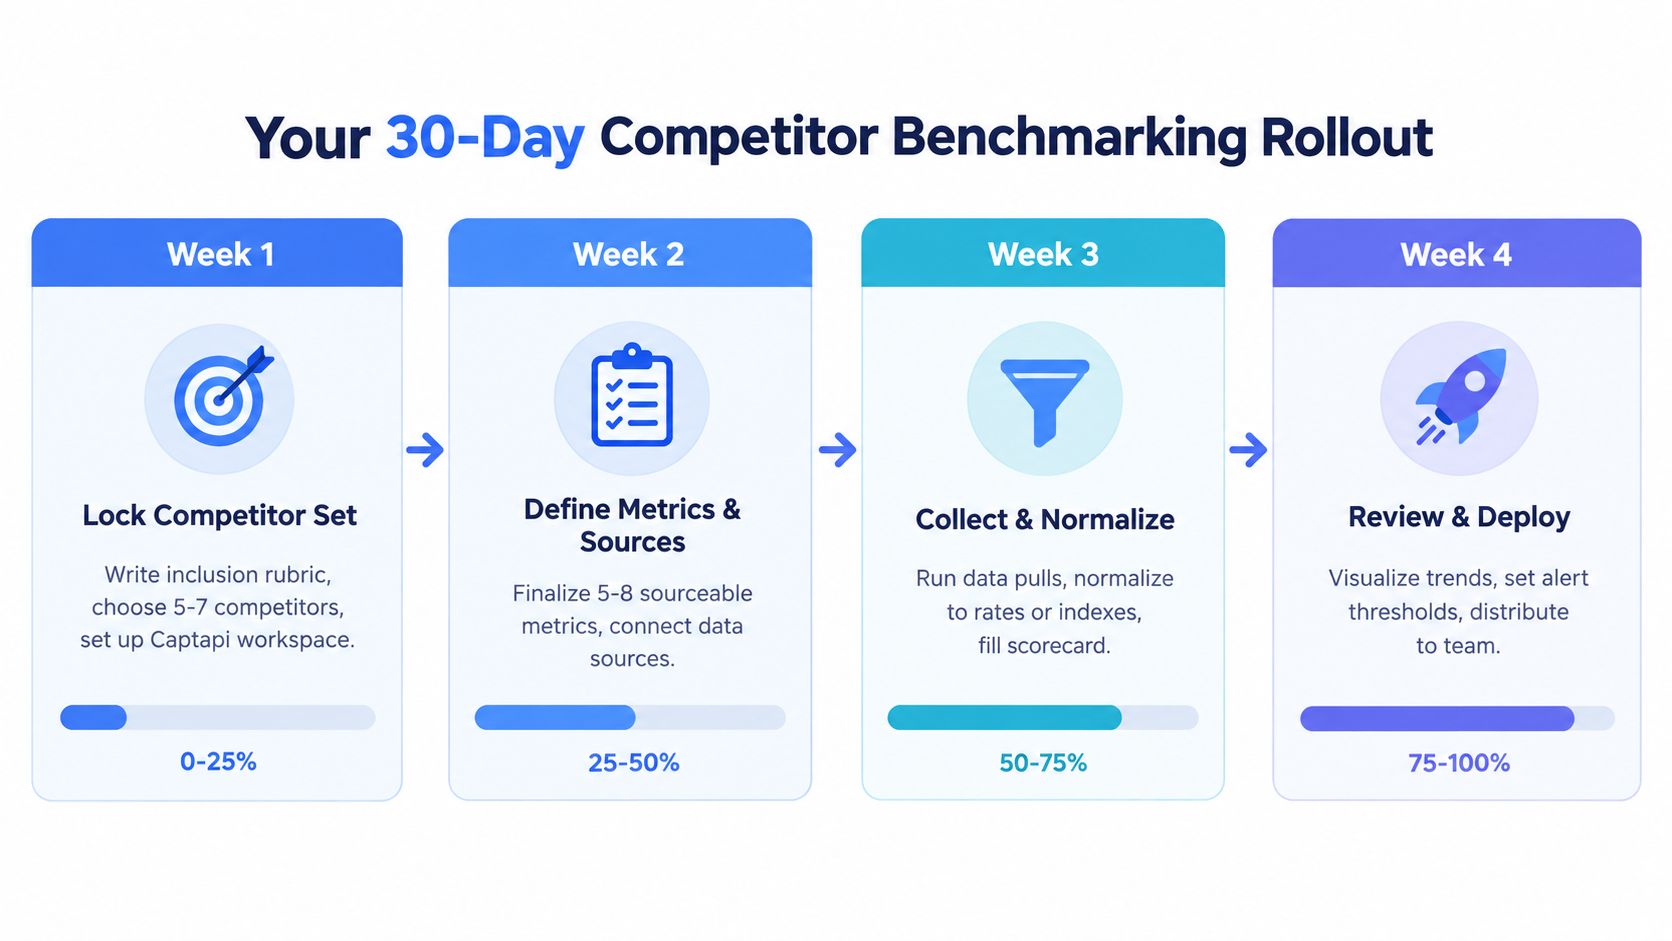
Week 1 establishes the comparison
Lock the peer set and write the inclusion rubric before collecting results. Assign each competitor a direct, aspirational, or adjacent role, document the rationale, and define the query clusters or channels that matter. Create the collection workspace, store source credentials securely, and confirm that every selected source returns test data.
Exit criterion: The team has an approved peer memo, a stable watchlist, named owners, and successful test pulls from the required sources.
Week 2 defines the scorecard
Choose five to eight metrics that can be refreshed on the intended cadence. Add the source, definition, time window, denominator, normalization method, and failure treatment to the metric dictionary. Run a 90-day historical backfill where the source supports it, clearly labeling estimated, missing, and directly observed values. The backfill gives the first dashboard a baseline without pretending every historical row has identical quality.
Exit criterion: Each metric has a working feed, a documented definition, and a visible provenance field.
Week 3 creates the comparable view
Transform absolute counts into appropriate rates or percentiles, preserve ratios with their definitions, and calculate share of voice and gap to leader. Publish the first comparison view with filters for competitor, channel, query cluster, date range, and source status. Ask a skeptical stakeholder to trace several values back to raw records.
Exit criterion: A reviewer can reproduce the displayed values and explain what action each metric could influence.
Week 4 deploys the operating rhythm
Switch on weekly alerts, schedule the monthly recalibration, and document at least three named triggers for an unscheduled rerun. Brief leadership on what the benchmark can and can't establish, especially where external data is estimated or incomplete. End the month with one adoption meeting. The decision should be explicit: accept the benchmark as a standing system, or reduce its scope before the next planning cycle.
Exit criterion: Alerts have owners, the review calendar is booked, and the team has agreed on the first actions tied to the dashboard.
A benchmarking program works when it survives ordinary weeks, not just launch week. Start with the smallest peer set and metric basket that can support a real decision, preserve source provenance, and let the system earn additional complexity only when stakeholders use it.
Captapi gives growth and marketing teams a unified REST interface for public data across YouTube, TikTok, Instagram, and Facebook, including transcripts, comments, engagement metrics, channel details, and search results. Use it to feed a repeatable competitor monitoring pipeline instead of rebuilding separate platform connectors, then visit Captapi to create an API key and start wiring your benchmark.