
Instagram Engagement Metrics: A Complete Measurement Guide
A carousel can outperform a Reel on Instagram even while the Reel reaches more people. That tension is the story in Instagram engagement metrics. One 2026 benchmark summary reported average engagement around 0.55% for carousels, 0.52% for Reels, and roughly 0.45% to 0.48% overall, with Socialinsider also noting a 24% year-over-year decline in one benchmark window, according to this Instagram statistics roundup.
Most guides treat engagement as a scoreboard. Analysts know it's a measurement problem. Instagram is large enough that tiny percentage moves still matter at scale, especially on a platform that industry summaries in 2026 described as having roughly 2.0 billion to 3.0 billion monthly active users worldwide, with more than 500 million daily users and frequent usage patterns, as compiled in these 2026 Instagram usage statistics. But the more important question isn't whether a post got engagement. It's whether the metric you chose matches the decision you're trying to make.
Table of Contents
- Why Instagram Engagement Metrics Are Harder Than They Look
- The Core Instagram Engagement Metrics You Need to Track
- Engagement Rate Formulas and the Denominator Problem
- Benchmarks by Format and Account Size
- Inflation, Spam, and the Authenticity Gap
- How to Move Each Metric That Matters
- Extracting Instagram Engagement Metrics via APIs and Scrapers
Why Instagram Engagement Metrics Are Harder Than They Look
A post with 1,000 likes doesn't mean much until you ask, “Out of what?” Out of followers? Out of people reached? Out of total impressions? Analysts who work with large account sets learn fast that engagement is less a popularity contest and more a denominator choice.
A follower-based rate can make a small, concentrated audience look brilliant and a large, stale audience look broken. A reach-based rate can make a post look strong if distribution was tight but response was intense. An impression-based rate can flatten the story when the same viewers saw the post multiple times.
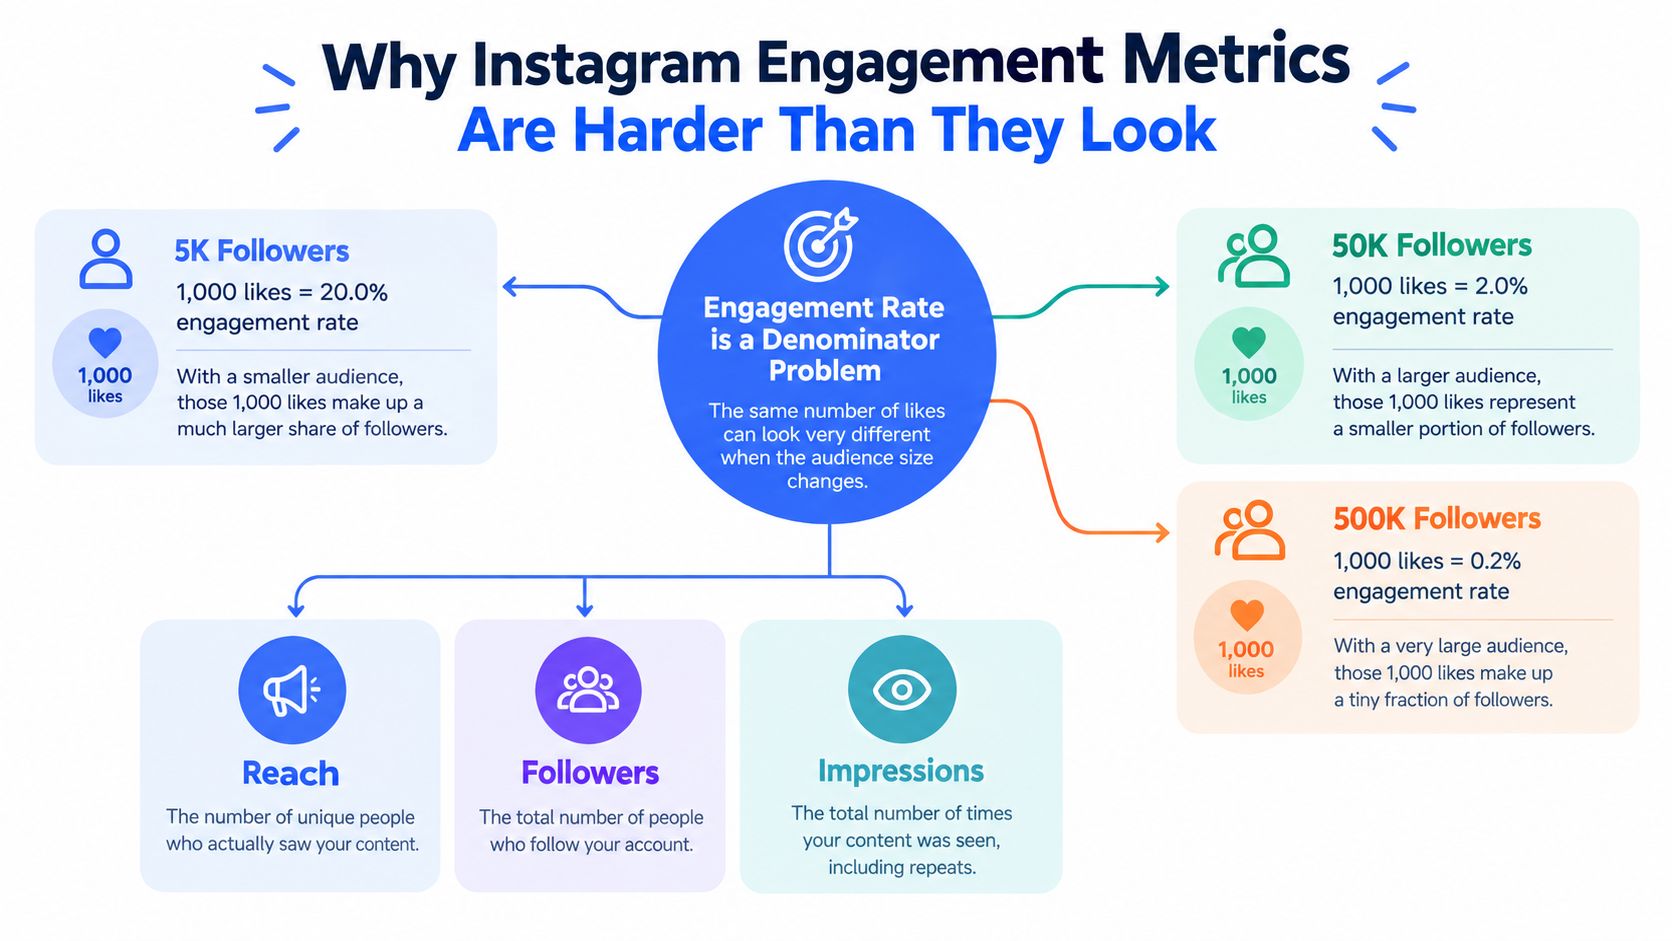
The same post can tell three different stories
Instagram's own consumption pattern creates this problem. Some posts travel mostly to followers. Others break out to non-followers. Reels often do the latter. Carousels often drive deeper interaction from people who already care. That means one post can look mediocre on a follower basis and excellent on a reach basis.
Buffer's benchmark guidance makes this explicit: follower-based engagement rate = (likes + comments + saves + shares) ÷ followers, while reach-based engagement rate = total engagements ÷ impressions for cases where you need a denominator tied to actual distribution volume, especially across paid and organic comparisons, as explained in Buffer's Instagram benchmark methodology. The wording there is a reminder that even industry sources sometimes blur “reach” and “impressions” in practice, which is exactly why analysts need to document formulas before they report.
Practical rule: If two dashboards show different engagement rates for the same post, don't ask which tool is wrong first. Ask which denominator each tool used.
Raw interactions aren't the same as meaningful response
Likes are cheap. Saves and shares cost more intent. Comments sit in the middle because quality varies wildly. A thoughtful comment usually signals attention. A string of fire emojis might signal habit, automation, or pod behavior.
Teams that want cleaner reporting usually separate engagement into three buckets:
- Vanity response: likes and lightweight reactions
- Intent response: comments, saves, replies, profile visits
- Distribution response: shares, repost-like sends, non-follower reach expansion
That separation matters more than ever when reporting to stakeholders who want one clean KPI. A single metric can hide weak audience quality, stale followers, timing effects, and restricted visibility on private surfaces. If you're building a reporting layer, a broader social media measurement framework helps keep those distinctions intact.
Any single Instagram number is a sample of a sample. It depends on timing, audience freshness, format, and how completely your tool can see the underlying data.
The Core Instagram Engagement Metrics You Need to Track
The fix is simple. Group Instagram metrics by what behavior they capture, then decide which ones matter for the business question in front of you.
What each metric really measures
| Metric | What It Measures | Scope | Algorithmic Weight |
|---|---|---|---|
| Likes | Fast approval, low-friction feedback | Public on many posts, visible in native analytics and some third-party tools | Low to moderate |
| Comments | Conversation and active attention | Public plus native analytics depth | Moderate |
| Saves | Private bookmarking and revisit intent | Mostly in-app professional analytics and connected tools with access | High |
| Shares | Distribution through sends and repost behavior | Mostly in-app professional analytics and some integrated tools | High |
| Reach | Unique accounts exposed to content | Native analytics, sometimes third-party if account access exists | Foundational, not engagement itself |
| Impressions | Total exposures, including repeat views | Native analytics and some integrated reporting tools | Foundational |
| Profile visits | Interest in the account behind the post | Native analytics | Moderate as a conversion-adjacent signal |
| Link CTR | Outbound action on links | Native analytics and web analytics stack | High for traffic goals |
| Story replies and sticker taps | Direct-response behavior inside Stories | Native analytics | High for interactive Story content |
| Video views | Initial consumption signal | Public for some posts, fuller detail in native analytics | Moderate alone |
| Watch time and completion | Attention quality and retention | Native analytics, especially for video surfaces | High for video diagnosis |
Likes are still useful, just not sufficient. They tell you whether the packaging worked well enough to stop a scroll. They don't tell you whether the post was useful, memorable, or shareable.
Saves and shares matter more because they reflect delayed value and distribution value. That's why a post with fewer likes but stronger saves often has more strategic value than a superficially popular image.
Public metrics versus private metrics
Public Instagram data only shows part of the picture. A competitor analyst can usually inspect likes, comments, captions, and sometimes view counts on public posts. They usually can't inspect saves, Story replies, profile visits, or sticker interactions without account-level access.
That creates a common reporting split:
- Publicly observable metrics are good for competitive tracking and creator screening.
- Account-private metrics are better for content diagnosis and conversion analysis.
- Hybrid metrics combine public post data with private account insights for cleaner internal reporting.
A lot of confusion in Instagram engagement metrics comes from mixing those layers. If one analyst reports public likes and comments while another includes saves and shares from native insights, both can be “right” and still produce conflicting conclusions.
Comments tell you what people said in public. Saves tell you what they wanted to keep in private.
For teams standardizing their taxonomy, this guide to social media engagement metrics is useful because it forces the more important question: which metrics indicate attention, which indicate intent, and which indicate distribution.
A practical taxonomy
Use three labels in your dashboards:
- Vanity metrics for likes and surface-level views
- Intent metrics for saves, replies, profile visits, and clicks
- Distribution metrics for shares, sends, and non-follower reach
That naming convention does more than tidy a dashboard. It prevents you from treating every interaction as equal when it clearly isn't.
Engagement Rate Formulas and the Denominator Problem
There isn't one engagement rate. There are several, and each rewards different account shapes, content formats, and distribution patterns. If you don't choose deliberately, your reporting will drift.
Engagement Rate Formulas Compared
| Formula | Calculation | Best For | Pitfall |
|---|---|---|---|
| Follower-based ER | (Likes + comments + saves + shares) ÷ followers | Stable benchmarking for account growth stages | Punishes accounts with inflated or dormant followers |
| Reach-based ER | Total engagements ÷ reach | Organic posts where you care about response from actual viewers | Volatile when reach is unusually low |
| Impression-based ER | Total engagements ÷ impressions | Paid campaigns and blended distribution analysis | Double-counts repeat exposures from the same person |
The denominator changes the verdict. That's not a technicality. It's the whole interpretation.
Follower-based rates are stable, but often unfair
Follower-based engagement rate remains popular because follower count is easy to understand and relatively stable over short periods. It's useful when benchmarking creators or comparing your own account across months.
Its weakness is obvious once an audience gets messy. Bought followers, inactive followers, regional mismatch, or old viral spikes all enlarge the denominator without improving the chance of present-day engagement. The result is a metric that can understate healthy content on a weak-quality audience base.
Reach-based rates align better with actual consumption
A more behaviorally honest approach is to compare engagement with the people who saw the content. Buffer's benchmark guidance argues that this type of normalization is better for cross-post and paid-versus-organic comparisons because it lines up with how the content was distributed and consumed, as outlined in their Instagram benchmarks article.
That doesn't make reach-based analysis perfect. Low-reach posts can produce unstable rates, especially when a small but loyal slice of viewers interacts heavily. In practice, that means reach-based ER is strongest when you compare like with like, such as organic Reels against other organic Reels.
Don't average engagement rates across mixed formats and call it a benchmark. A Reel, a carousel, and a Story don't earn distribution the same way.
Impression-based rates matter most in paid environments
Impression-based ER is often the cleanest denominator for paid analysis because impressions represent the actual delivery volume you bought or influenced. It becomes especially helpful when frequency matters.
Its trade-off is conceptual, not mathematical. Repeated exposures from one person count multiple times. If your content works because it sticks on repeated viewing, that may be fine. If you're trying to estimate unique audience response, it can muddy the picture.
The decision rule is straightforward:
- Use follower-based ER for creator screening and growth-stage benchmarking
- Use reach-based ER for organic content diagnosis, especially posts that travel beyond followers
- Use impression-based ER for paid media and blended distribution reporting
Most disagreements over engagement rate don't come from arithmetic. They come from mismatched use cases.
Benchmarks by Format and Account Size
On Instagram, a post at 0.5% engagement can be weak, average, or strong. The difference usually comes from two variables broad averages flatten. Format and audience size.
A platform-level average is useful only as a rough ceiling check. Once you compare a Reel from a 20,000-follower account to a carousel from a 400,000-follower account, the average stops helping and the denominator starts distorting the conclusion.
Format benchmarks break down quickly if you collapse unlike posts
Socialinsider's 2026 benchmark reporting puts overall Instagram engagement in the sub-1% range, with carousels slightly ahead of Reels on average, according to Socialinsider's Instagram benchmark study. That result matters because it contradicts a common reporting habit. Teams often assume video is the default winner, then treat underperforming Reels as a creative problem when the issue is benchmark selection.
The more practical read is narrower. Reels usually win discovery. Carousels often win depth signals such as saves, swipes, and multi-second attention. Single images still work, but they tend to have less room for interaction density unless the account already has strong audience affinity or the creative lands unusually well.
That means the right comparison set is format-specific before it is account-wide.
Instagram Engagement Rate Benchmarks by Format and Follower Band (2026 medians)
| Follower Band | Reels | Carousel | Single Image | Stories (poll/sticker) |
|---|---|---|---|---|
| Nano | Often above broad platform averages because a small audience can interact densely | Frequently strong, especially for educational or opinion-led posts | Can perform well if the audience is tightly aligned | Often high if viewers recognize the creator and respond habitually |
| Micro | Discovery can expand beyond followers, which helps reach but can add volatility | Commonly one of the steadiest formats for saves and shares | More exposed to creative variance | Useful for loyalty and repeat interaction |
| Mid-tier | Rates often compress as audience breadth rises | Usually more stable than single image posts | Commonly less efficient than smaller tiers | Better read as a retention signal than a top-line growth signal |
| Macro | Reach volume can hide weaker interaction density | Still productive when the post offers clear utility | Often soft on a follower basis | Sensitive to audience fatigue and posting cadence |
| Mega | Distribution scale keeps impressions high even when response rates slip | Can preserve depth better than other feed formats | Often the weakest format by follower-based ER | Better for relationship maintenance than benchmark bragging rights |
The table is qualitative on purpose. Public benchmark datasets rarely use identical engagement definitions across formats, and story metrics are especially inconsistent because outside analysts often have limited access to sticker taps, exits, and completion data.
Account size changes what "good" means
Smaller accounts usually post higher engagement rates than larger ones. That pattern shows up across benchmark studies and matches what analysts see in account audits. The reason is rarely “better content” in a simple sense. Smaller audiences are often newer, more concentrated around a niche, and less saturated by repeated exposure.
Large accounts face a different constraint. As audience breadth expands, a bigger share of followers becomes passive, misaligned, or geographically irrelevant to a given post. That lowers follower-based rates even when absolute interactions rise. A macro creator getting 8,000 interactions can be outperforming a nano creator with a prettier percentage.
This is why percentile rank inside a size band is often more useful than a universal target.
Denominator sensitivity gets sharper at the format level
Format benchmarks also shift depending on the denominator you use. A Reel can look weak on a follower basis and strong on a reach basis if non-followers saw it but interacted lightly. A carousel can look average on reach and excellent on saves per reach because the audience that stayed with it found it useful.
That is one reason mixed-format monthly reporting creates bad decisions. It rewards whichever format gets the cheapest distribution, not necessarily the format that serves the business goal best. Teams evaluating video-heavy strategies should separate viewing behavior from feed interactions and use format-specific diagnostics such as these video engagement metrics.
Timing adds another layer. For save-oriented educational posts, publish-time tests can change results enough to blur creative comparisons. Teams running carousel experiments can use 2026 carousel posting windows as a testing input, then validate against their own audience response rather than treating any posting schedule as universal.
The benchmark that holds up best is narrow: same format, similar account size, similar objective, same denominator. Anything broader looks neat in a dashboard and breaks under analysis.
Inflation, Spam, and the Authenticity Gap
Accounts with inflated audiences often fail a simple reconciliation test. Their visible engagement looks healthy, but reach, comment quality, and repeat interaction patterns do not match what a real audience usually produces.
A raw engagement rate does not solve that problem. Purchased followers weaken follower-based rates by expanding the denominator with inactive accounts. Pods, giveaway traffic, and comment automation distort the numerator in the opposite direction. The result is a metric that can look acceptable while describing very little about actual audience response.
One 2026 comparison found a wide gap between authentic accounts and accounts with purchased followers, with average engagement rates of 3.4% versus 0.9%. The same report also noted that Reels produced more than four times the interactions of single-image posts in its sample, which matters because format can mask audience-quality problems if analysts read the interaction total without context (UpGrow's engagement purity report).
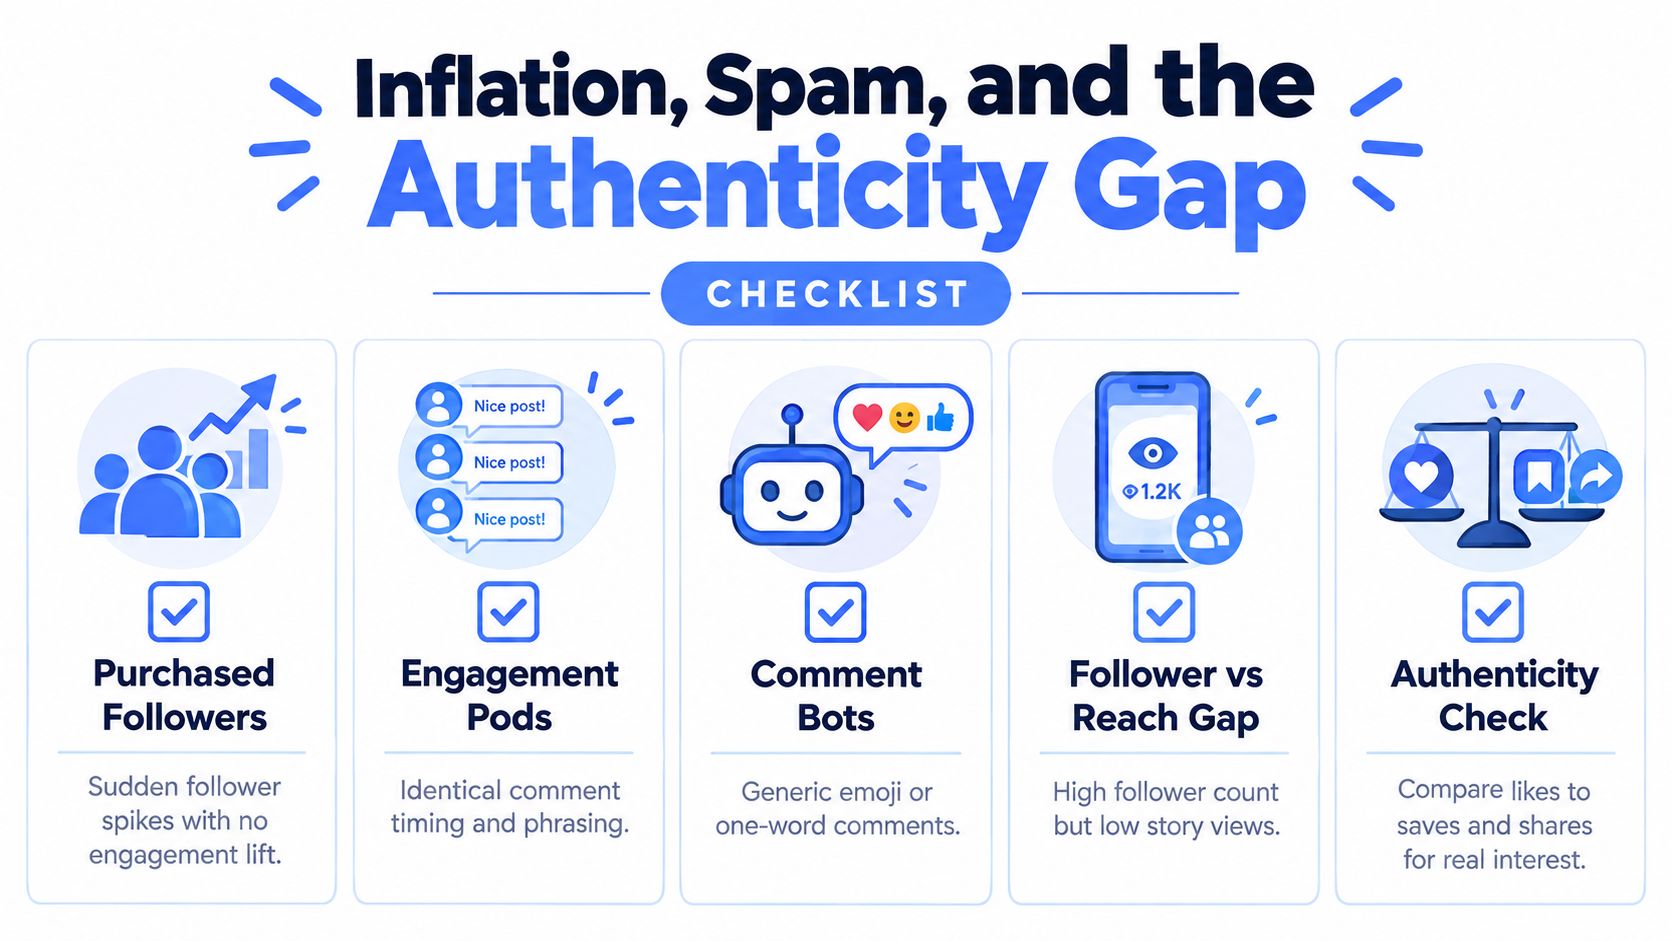
What inflated engagement usually looks like
The clearest warning sign is inconsistency across related metrics.
An account gains followers, but reach per post stays flat. Likes rise, but saves and shares do not. Comment counts improve, yet the comments are interchangeable across posts and come from weak profiles with little posting history. Reels can complicate the picture because the format naturally expands distribution, so a temporary lift in interactions is not enough to prove audience quality.
Useful audit signals include:
- Follower spikes without comparable reach growth
- Repetitive or generic comments, especially emoji clusters and recycled one-line praise
- Frequent engagement from thin accounts with low activity or incomplete profiles
- High like volume with weak deeper actions, such as low saves, shares, replies, or DM activity
- Post-to-post volatility that looks operational rather than creative, such as sudden bursts in the first minutes followed by weak downstream response
The harder-to-fake metrics deserve more weight
Surface engagement is cheap to imitate. Higher-intent actions are not.
Saves, private shares, story replies, and sustained comment threads usually require real interest. They are still imperfect. A giveaway can lift comments, and a heavily promoted educational post can collect saves from low-fit viewers. But these signals usually resist mass inflation better than likes alone.
For a practical authenticity check, review four relationships instead of one headline rate:
- Follower growth slope over time
- Comment quality, not just comment count
- Save-to-like ratio
- Reach-to-follower ratio
A modest engagement rate on a credible audience is often more valuable than a higher rate built on weak followers or synthetic interaction. That is the authenticity gap. Two accounts can post the same rate while producing very different business outcomes.
How to Move Each Metric That Matters
Different metrics respond to different creative decisions. Teams waste months when they try to lift every engagement metric with the same content tactic. Instagram doesn't work that way.
Moves that raise surface response
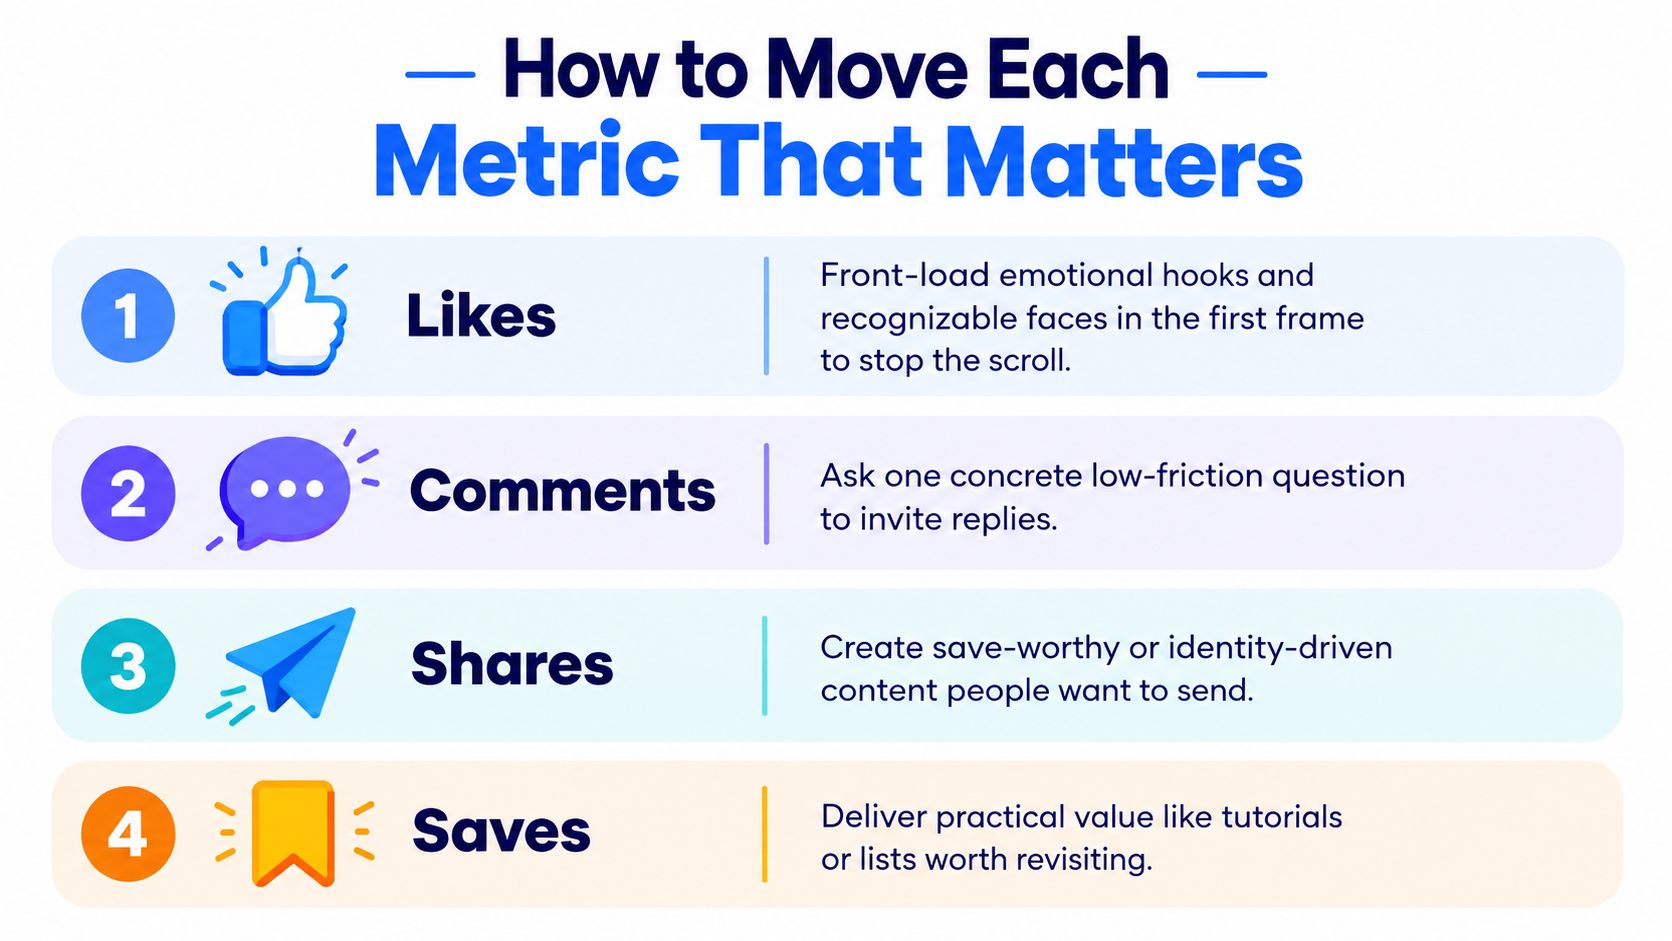
If likes are soft, the first frame usually needs work. Recognizable faces, contrast, motion cues, or a clear emotional setup often improve the initial stop. Likes behave like applause. If people don't instantly understand the scene, they won't clap.
Comments rise when the ask is concrete. Broad prompts such as “thoughts?” usually underperform compared with one narrow question, one comparison, or one forced choice. Pinning an early reply also helps because it tells viewers there's an active conversation worth joining.
Here's a useful walkthrough on creative mechanics and posting strategy:
Moves that raise high-intent engagement
Saves respond best to utility. Tutorials, checklists, swipe files, before-and-after breakdowns, and process carousels all create the same mental reaction: “I'll need this later.” Each slide should still stand on its own, because weak middle slides kill saves even when the cover is strong.
Shares are different. People send content that helps them express identity, signal taste, or help someone else quickly. Rankings, templates, sharp opinions, and concise how-tos travel well because the sender gains social value by forwarding them.
A simple way to map tactics to outcomes:
- To lift likes, improve packaging and first-frame clarity
- To lift comments, ask one narrow question with low friction
- To lift saves, package evergreen utility that survives the moment
- To lift shares, create content people want attached to their name in a DM
Reach, visits, and follow-through need a different close
Reach is mostly a function of retention and distribution fit. On Reels, that means a strong hook, on-screen clarity for sound-off viewing, and an ending that resolves without feeling padded.
Profile visits and follows come from identity clarity. A Reel can create curiosity without creating conversion. The fix is often a direct account cue near the end, telling viewers what the account consistently publishes and why it's worth following.
Story replies need a more intimate rhythm. Mid-sequence prompts, polls, and direct-response stickers outperform generic “DM us” asks because they lower the social cost of replying.
The key is simple: stop talking about “engagement” as if it were one behavior. It isn't.
Extracting Instagram Engagement Metrics via APIs and Scrapers
Collecting Instagram metrics is partly an analytics problem and partly a systems design problem. The challenge isn't just getting data. It's deciding what level of access you need, how often values should refresh, and how much compliance risk you're willing to carry.
API and scraping options for Instagram engagement metrics
| Source | Metrics Available | Rate Limits | Compliance Risk |
|---|---|---|---|
| Official Graph API | Strong access to approved business and creator insights, including account-level and media-level analytics where permission exists | Platform-controlled and quota-based | Lower when used within policy |
| Public web scraping | Public post details such as likes, comments, captions, and sometimes views depending on visibility | Technically variable and infrastructure-dependent | Higher due to platform terms and privacy concerns |
| Internal first-party exports | Native analytics from the account owner's own dashboards | Manual or platform-limited | Lower, but operationally slower |
| Unified third-party data services | Public data extraction through a consistent interface | Vendor-defined limits and caching behavior | Depends on method and jurisdiction |
Official access is cleaner when you manage the account. It's also restrictive. Private account data, Story-specific behavior, and advanced insights usually require the right account type, permissions, and app setup. Scraping can widen public visibility, but it introduces legal, platform, and maintenance risk.
The real trade-off is freshness versus stability
Not every metric needs the same refresh cadence. Reach and impressions can move quickly after publishing. Follower counts usually drift more slowly. Comments may require faster polling during active launches and much slower polling after the post stabilizes.
That's why a sane extraction design uses different cache rules by metric family:
- Fast-changing metrics like comments or early post delivery get shorter refresh windows
- Medium-drift metrics like post likes can refresh on a moderate cadence
- Slow-drift metrics like follower totals can refresh less often without hurting analysis
A dashboard that hammers endpoints uniformly often burns calls on stable metrics and misses the moments when fast-changing metrics need closer tracking.
Tool choice depends on the question
If you need account-owner insight data, the official route is usually the only defensible option. If you need public competitor tracking at scale, teams often add extraction layers that can observe public posts without account-level permissions.
One option in that category is Instagram public data API access. Captapi exposes public Instagram post and account fields through a unified REST interface, which is useful when teams want public likes, comments, views, or follower data in a downstream analytics pipeline without building separate ingestion logic for each platform.
The good practice isn't “use APIs” or “use scrapers.” It's to log every data gap, tag every metric with its source and timestamp, and treat sudden discontinuities as possible collection issues before you call them audience behavior.
If you're building dashboards, competitor monitors, or ingestion pipelines for Instagram performance data, Captapi gives you one developer-first way to pull public social metrics into a consistent REST workflow. It's especially useful when your team needs Instagram engagement inputs alongside YouTube, TikTok, or Facebook data without stitching together separate extraction stacks by hand.