
What Is Social Listening and How It Works
The most popular advice about social listening is also the least useful: track your mentions, measure sentiment, and watch the dashboard. That describes social monitoring, not intelligence. A reliable social-listening practice must collect public conversations, add context, identify patterns, account for sampling bias, and route findings to someone who can make a decision.
That distinction matters because online conversation is large, fragmented, multilingual, and unevenly representative. What people post can reveal visibility, intensity, unmet needs, or emerging risk, but it doesn't automatically represent the wider market. The practical question isn't only “What are people saying?” It's “What signal is present, how trustworthy is it, who does it represent, and what should the business do next?”
Table of Contents
- Defining Social Listening as an Intelligence Practice
- Social Monitoring vs Social Listening
- Building a Reliable Measurement Pipeline
- Navigating Scale and Audience Bias
- Detecting Crises Through Conversation Velocity
- Privacy and Compliance as Methodological Constraints
Defining Social Listening as an Intelligence Practice
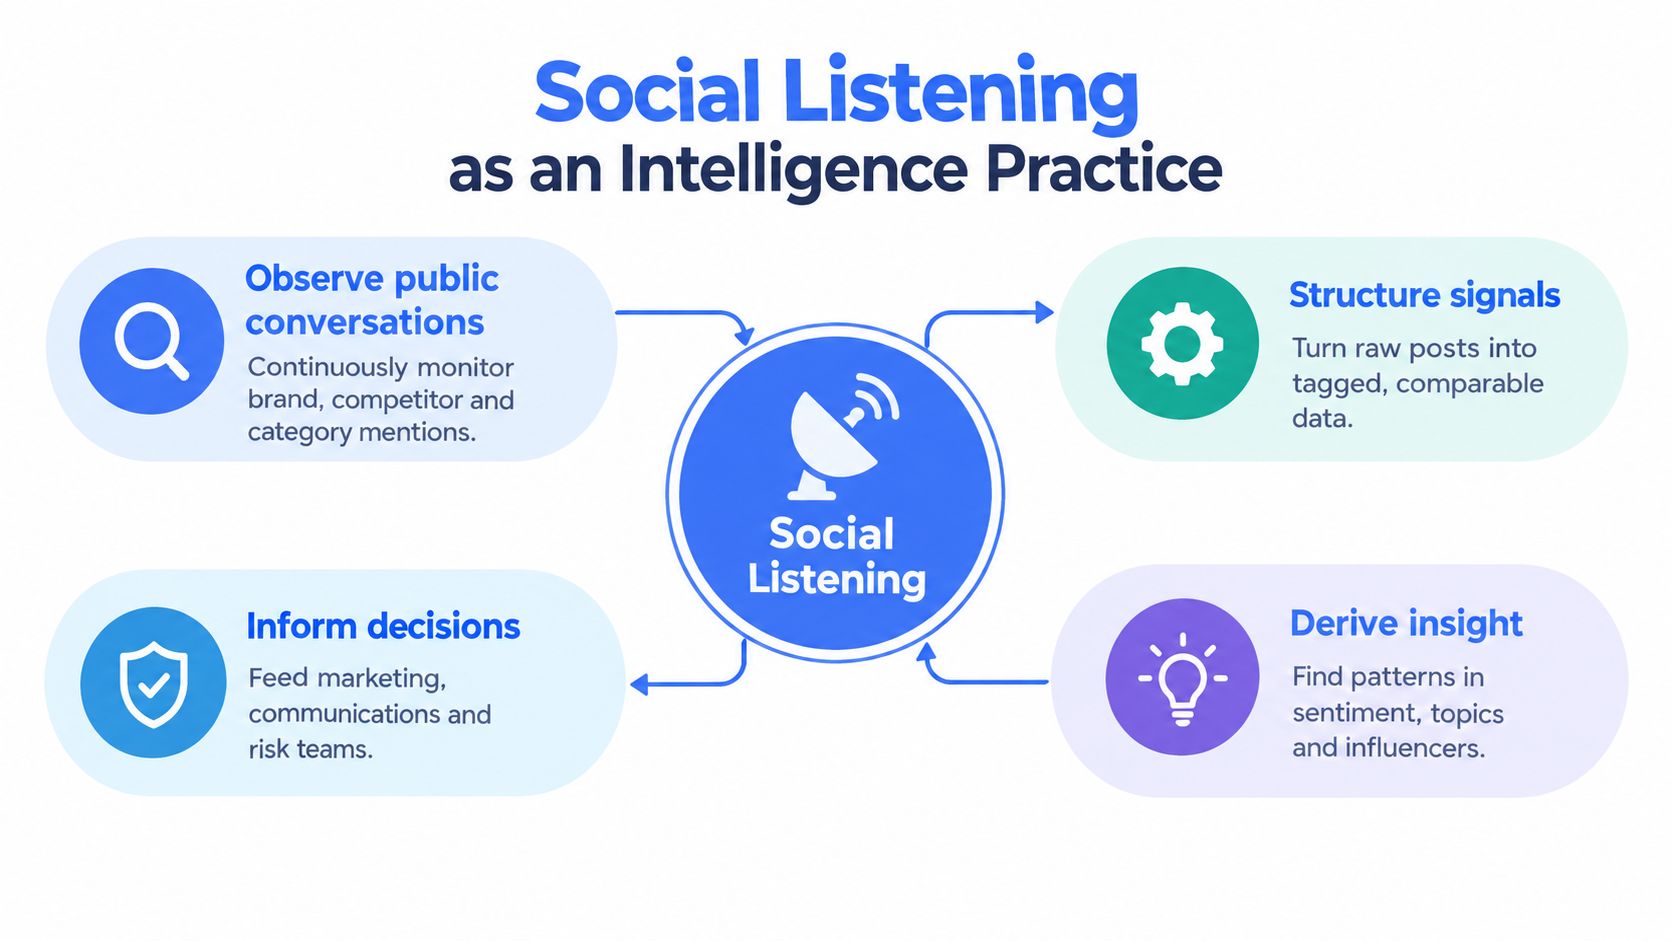
Social listening is the structured practice of observing, interpreting, and responding to public conversations and other digital signals. It combines data collection with communication analysis, context, and an operational decision. Counting mentions can tell you that content exists. Listening asks what the content means, whether a pattern is developing, and which team should act.
Academic research published in 2018 framed social listening as an emerging dimension of listening that combines appreciative, critical, discriminative, and therapeutic listening to obtain interpersonal information and social intelligence through mediated channels. The practical implication is important: social listening belongs to communication and intelligence work, not only to a marketing-software category. You can read the foundational treatment in this academic discussion of social listening.
From public chatter to business intelligence
The raw material includes posts, comments, reactions, transcripts, reviews, videos, and community discussions. A listening system observes those signals, structures them into comparable records, derives themes and changes, then informs communication, customer experience, product, research, or risk decisions.
That workflow supports several practical jobs:
- Brand analysis: Identify how people describe a company, product, or service without relying only on owned channels.
- Customer-experience research: Group recurring friction, confusion, praise, and requests into themes that support service or product work.
- Competitor intelligence: Compare narratives, complaints, positioning, and audience reactions across brands. A useful companion is this guide to competitive intelligence.
- Issue detection: Find unusual shifts before they become routine reporting.
- Trend identification: Separate a growing narrative from an isolated post or a temporary campaign effect.
The move from one-to-one messaging to persistent, searchable, multimodal conversations makes structure necessary. A discussion may start in a video comment, continue through reactions, and develop inside another community. Teams that inspect one platform manually will often miss the path between those signals.
Listening requires a decision loop
A dashboard isn't the finished product. The finished product is a defensible interpretation connected to an owner, a threshold, and an action. That might mean sending a product issue to engineering, asking customer care to investigate, revising campaign language, or escalating a potential crisis.
For teams working with professional audience data, a LinkedIn content intelligence platform can provide a useful adjacent reference point for organizing content signals and interpreting professional conversations. The same principle applies regardless of the source: collection is only the beginning.
Practical rule: If a listening report ends with a mention count and no explanation of meaning, coverage, confidence, or next action, it's a monitoring report with better formatting.
Social Monitoring vs Social Listening
Monitoring and listening work together, but they answer different questions. Monitoring detects content, usually through keywords, mentions, accounts, or alerts. Listening interprets the content across time, topics, audiences, and channels, then connects the interpretation to a business response.
A customer-care team may need monitoring to find a direct complaint quickly. A product team needs listening to determine whether that complaint belongs to a recurring problem, whether similar language appears elsewhere, and whether the issue is becoming more visible.
Monitoring vs Listening Comparison
| Feature | Social Monitoring | Social Listening |
|---|---|---|
| Primary question | What was posted, and where? | What does the conversation mean? |
| Main activity | Detect mentions, comments, and keywords | Interpret themes, context, sentiment, and change |
| Typical timeframe | Immediate and reactive | Continuous, historical, and comparative |
| Data shape | Individual posts or alerts | Normalized, grouped, and analyzed conversations |
| Context | Often limited to the matched item | Includes author, topic, platform, timing, and related narratives |
| Output | A response queue or notification | An insight, decision, workflow, or escalation |
| Best use | Community management and rapid response | Product, brand, research, strategy, and risk decisions |
| Main failure mode | Too many alerts or missed variations | False confidence from biased or poorly classified data |
Monitoring isn't inferior. It's the tactical layer that keeps teams responsive. The failure happens when an organization treats alerts as conclusions. A spike in mentions could reflect a campaign, a joke, a bot cluster, a product failure, or a news event. The matched keyword doesn't explain which one is happening.
When the extra analysis pays off
Suppose a team sees repeated complaints about a service feature. Monitoring can surface individual posts and help an agent reply. Listening links those posts by topic, checks whether the narrative appears across channels, compares the current pattern with a baseline, and sends a structured issue to the team responsible for the feature.
The same distinction applies to communities that use indirect language. Teams studying how startups market on Reddit need more than a keyword alert because context, norms, and discussion history shape how a post should be interpreted. A literal match can be positive, negative, irrelevant, or part of a broader argument.
For developers, a social media monitoring API can help supply the detection layer. The listening layer still requires query design, normalization, entity resolution, semantic grouping, quality checks, and a clear route from signal to action.
Monitoring tells you where to look. Listening helps you decide what the evidence means.
Use monitoring when the response is tied to an individual item and speed matters. Use listening when the decision depends on a pattern, comparison, change over time, or explanation of cause. Mature teams don't choose one permanently. They connect monitoring alerts to a listening workflow so urgent signals receive immediate attention while recurring patterns feed longer-term decisions.
Building a Reliable Measurement Pipeline
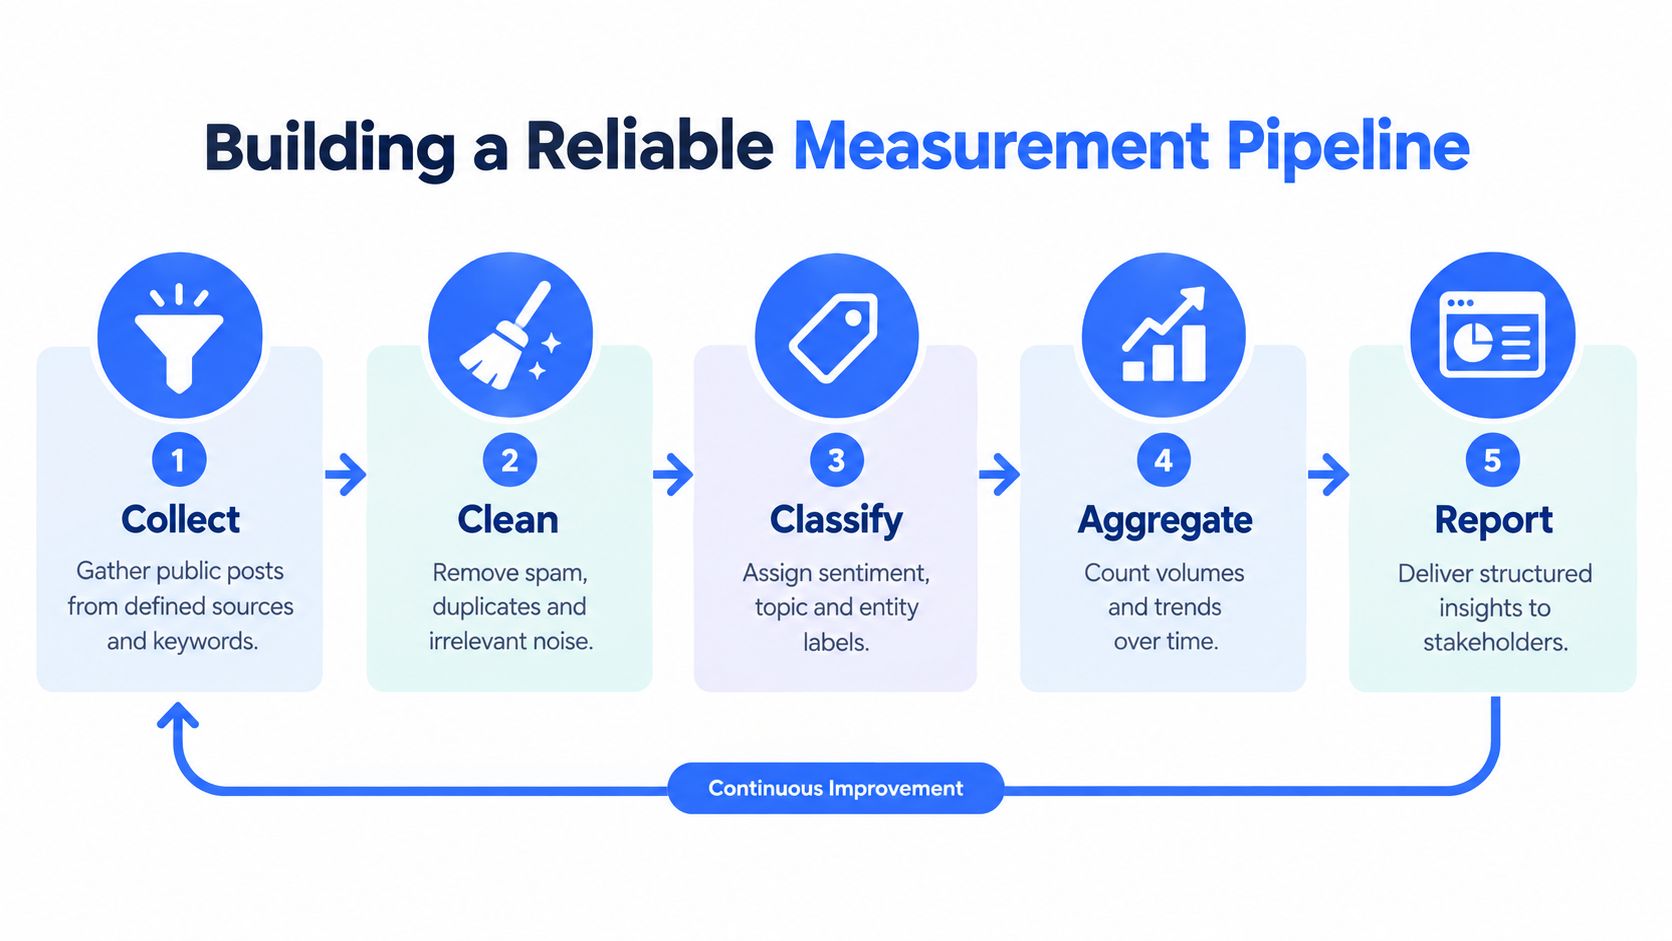
A social-listening system should be designed like a measurement pipeline, not assembled as a collection of dashboard widgets. The core stages are collect, clean, classify, aggregate, and report, with feedback from reporting back into collection and query refinement.
1. Collect deliberately
Start with a business question and a defined data scope. Collect public posts, comments, transcripts, reactions, and search results from relevant platforms, keywords, entities, competitors, and time windows. A broad query isn't automatically a good query. It can create noise, miss synonyms, or capture a term with an unrelated meaning.
Extraction tools can provide the corpus, but the pipeline should preserve source, timestamp, URL or platform identifier where appropriate, query version, and collection constraints. Those fields support later auditing and help analysts explain why a trend appeared.
2. Clean and normalize
Different platforms expose different fields and formats. Normalize timestamps, language labels, engagement fields, author identifiers, media types, and entity names before comparing records. Deduplicate reposts and repeated comments, filter spam, and distinguish original content from replies or quoted material.
Entity resolution is especially important. A brand name may refer to a company, a product, a person, or an unrelated phrase. Product variants, abbreviations, misspellings, and competitor names need explicit handling. Without this step, a volume chart can look precise while measuring several different things at once.
A repeatable data-pipeline automation workflow helps teams make these transformations consistent rather than relying on manual spreadsheet edits.
3. Classify with uncertainty
Classifiers can assign sentiment, emotion, topic, language, entity, intent, and risk labels. They should prioritize and route content, not declare an unquestionable truth. Sarcasm, slang, code-switching, quotation, platform culture, and domain-specific language routinely create ambiguous cases.
An academic benchmark of Twitter sentiment-analysis tools found average overall accuracy ranging from below 50% for weaker systems to approximately 65% to 71% for the strongest tools, with substantial variation across datasets, as documented in this sentiment-analysis benchmark. That result supports a human-in-the-loop design, especially for high-impact content.
Maintain language- and domain-specific test sets. Track precision and recall separately for high-risk categories, review borderline classifications, and recalibrate when audience language or campaign topics change. A classifier that performs well on last quarter's language can degrade when the conversation changes.
The video below provides a visual introduction to the pipeline concept:
4. Aggregate and explain
Aggregation turns records into rates, distributions, topic clusters, and changes over time. Useful outputs include narrative acceleration, audience contribution, platform differences, engagement velocity, and the relationship between a topic and a brand or product entity.
Don't stop at “positive versus negative.” A useful result identifies which narrative is changing, which audience is driving it, where it appears, and whether the movement differs from a historical baseline. Teams evaluating adjacent AI search monitoring tools should apply the same standard: a tool is valuable when it produces traceable signals, not merely attractive summaries.
5. Report to an owner
Reports should state the finding, evidence, confidence, limitation, and recommended action. Route high-risk issues to an accountable owner, send recurring themes to the relevant operational team, and retain the underlying records needed for review. This closes the loop between measurement and decision-making.
Navigating Scale and Audience Bias
The addressable conversation is enormous, but scale doesn't remove sampling problems. DataReportal reported 5.24 billion active social-media user identities worldwide in early 2025, and users engaged with an average of 6.83 social platforms per month, according to its Digital 2025 social-media analysis. Those figures explain why cross-platform collection matters. They don't prove that social posts represent the population as a whole.
Volume measures intensity before prevalence
Social authors are self-selected. Platform participation, access, language, age, income, education, digital literacy, and community norms all influence who appears in the data. People with unusually strong experiences may be more likely to post, while highly active users can dominate a discussion.
That creates an important distinction:
- Conversation volume measures how much visible discussion exists.
- Conversation intensity measures how strongly or rapidly people are engaging.
- Estimated prevalence asks how widely the underlying need or opinion exists in the broader population.
These aren't interchangeable. A large number of posts can indicate a highly visible issue, a concentrated community, coordinated activity, or repeated amplification. It may not indicate that most customers share the same view.
Build coverage checks into the data model
Analysts should document which platforms, languages, regions, and audience groups the pipeline can observe. They should also record which communities are unavailable, which fields are missing, and whether platform behavior could distort comparisons.
A practical validation process includes:
- Compare sources: Check whether a theme appears across different platforms or only inside one community.
- Separate claims: Report observed volume separately from any inference about market prevalence.
- Calibrate externally: Compare social signals with surveys, customer records, sales data, or other offline evidence where those sources are available.
- Qualify demographic conclusions: Avoid treating inferred age, location, or identity as verified facts.
- Track uncertainty: Add coverage notes and confidence limits to dashboards and executive summaries.
Teams collecting public conversation data through a social media data-gathering workflow should preserve platform provenance so analysts can inspect these differences rather than collapsing everything into one total.
The right question is not “How many people think this?” when the system only knows how many posts it found. Ask instead, “Where does this signal appear, who is producing it, and what additional evidence would support a broader conclusion?” That phrasing protects decision-makers from mistaking a vocal online subgroup for the entire market.
Measurement discipline: Present social listening as an observation of public conversation unless you've validated its relationship to population opinion.
Cross-platform normalization helps with fragmentation, but it doesn't solve representation. A clean dataset can still describe an uneven sample. Reliability depends on documenting both the quality of the records and the limits of the audience behind them.
Detecting Crises Through Conversation Velocity
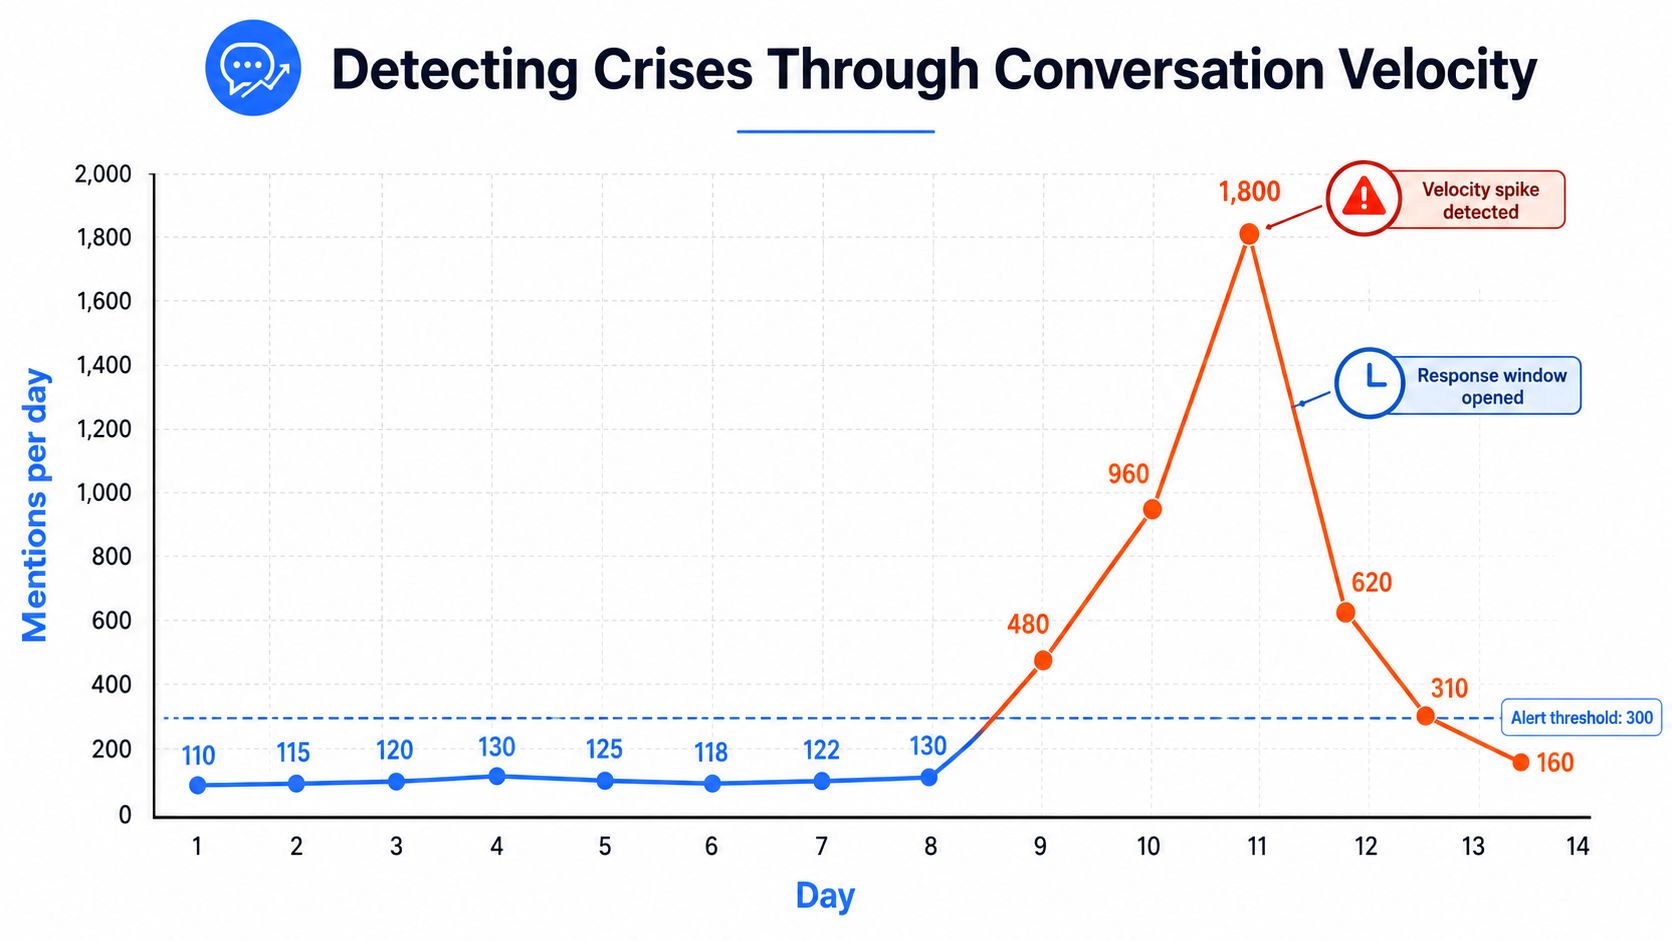
In crisis work, absolute volume is often less informative than velocity, the rate at which conversation changes. A brand may receive steady criticism without needing an emergency response. A sudden acceleration can indicate that a narrative has entered a new intervention window.
A practical alerting system calculates rolling baselines by platform, topic, geography, and time of day. It then looks for unusual movement in mention rate, negative-emotion share, engagement velocity, cross-platform propagation, and participation by influential or high-authority accounts.
Detect the pattern, not just the keyword
A keyword hit is weak evidence by itself. A stronger crisis signal combines several changes:
- Comment acceleration: The rate of new comments departs from the expected pattern.
- Sentiment movement: Negative emotion rises sharply or a previously stable topic shifts.
- Narrative formation: Related posts begin repeating the same explanation, allegation, or demand.
- Cross-platform spread: The conversation moves beyond its original community.
- Authority amplification: Larger accounts, journalists, organizations, or relevant experts begin participating.
Crisis-listening research describes these indicators, including sudden comment spikes, sharp sentiment shifts, narrative-cluster formation, and cross-platform spread. It defines response time as the interval between the first detectable signal and internal escalation, as explained in this crisis-management social-listening guidance.
Route alerts by severity
Sending every anomaly to every stakeholder creates alert fatigue. A better design assigns severity according to evidence and potential impact.
Low-confidence anomalies can enter an analyst queue with the source posts and timestamps attached. A simultaneous increase in volume, negative emotion, and high-authority amplification should page the accountable communications or risk owner. The alert should include the narrative cluster, affected platforms, representative examples, classification confidence, and the comparison baseline.
Store underlying posts and timestamps where your collection and governance rules allow it. Analysts need that evidence to distinguish coordinated activity, organic dissatisfaction, campaign fluctuation, and ordinary daily variation.
Velocity changes the response options available to a team. Early detection can create time for verification, stakeholder alignment, and a precise response. Delayed review leaves fewer choices and increases the chance that a larger audience encounters an incomplete or distorted narrative first.
Privacy and Compliance as Methodological Constraints
Public visibility doesn't automatically mean unrestricted permission to collect, combine, retain, or redistribute data. Privacy and compliance shape which voices enter the dataset, which fields analysts can use, and how confidently a team can interpret the result.
Closed communities, access restrictions, privacy expectations, incomplete self-disclosures, and scraping limits can exclude relevant voices. That exclusion can create selection bias. At the other extreme, combining apparently harmless attributes such as age, platform, and location may make individuals identifiable, particularly in vulnerable communities, as described in this research on privacy risks in social-media data.
Treat governance as data quality
A responsible pipeline records governance metadata beside analytical metadata. At minimum, teams should document:
- Purpose: Why the project needs the data and what decision it supports.
- Provenance: Where each record came from and how it was collected.
- Access scope: Whether content was public, consented, licensed, or otherwise restricted.
- Retention: How long raw records, derived features, and summaries remain available.
- Transformation history: Which cleaning, classification, aggregation, or redaction steps changed the data.
- Disclosure limits: Which fields are missing, inferred, or unsuitable for individual-level conclusions.
These fields affect interpretation. If a sensitive community is inaccessible, a lower volume may reflect reduced coverage rather than lower concern. If identifiers are removed but distinctive combinations remain, a generated summary can still preserve sensitive context.
Protect people without hiding trade-offs
Privacy safeguards may reduce analytical coverage. Aggressive collection may increase re-identification and ethical risk. Neither trade-off should disappear behind a dashboard score.
Minimize retained fields, avoid inferring sensitive traits from usernames or language without validation, aggregate small groups, and distinguish public data from consented research data. For AI and retrieval-augmented generation workflows, apply the same discipline to transcripts, comments, embeddings, prompts, and generated summaries. Removing a name doesn't necessarily remove the sensitivity of the underlying story.
Teams implementing an extraction workflow can use social-media compliance guidance as a starting point, but compliance isn't a checkbox delegated entirely to a tool. The organization using the data remains responsible for purpose, access, retention, review, and downstream use.
Social listening is useful when it makes uncertainty visible. A trustworthy system tells stakeholders what it observed, what it couldn't observe, how the data was transformed, and what conclusions it cannot support.
Captapi can supply structured public social data, including comments, transcripts, search results, and engagement signals across YouTube, TikTok, Instagram, and Facebook, so teams can build the collection layer of a listening pipeline without maintaining separate platform integrations. Visit Captapi to review the API and decide whether its extraction endpoints fit your monitoring, research, or intelligence workflow.