
Social Media Data Analysis: Methods, Metrics, and Pipelines
A growth team sees impressions rising across its native dashboards, so everyone expects the campaign to be healthy. Then support tickets increase, a cluster of critical comments spreads through replies, and a small group of accounts begins repeating the same allegation. The dashboards show visibility. They don't explain the narrative, its origin, or whether the same audience is reacting across platforms.
That gap is where social media data analysis becomes an engineering problem. Marketers need interpretable engagement and sentiment metrics, while ML teams need stable schemas, reproducible datasets, queryable history, embeddings, and features that can feed RAG, fine-tuning, or forecasting systems. A useful system has to serve both groups without treating a platform-specific total as universal truth.
Table of Contents
- Why Native Dashboards Stop Being Enough
- What Social Media Data Actually Is
- Engagement Metrics That Survive Cross-Platform Comparison
- Sentiment, Topic Modeling, and Network Analysis Compared
- An End-to-End Analysis Workflow With Sample Queries
- Feeding Analysis Results Into RAG and ML Pipelines
- Access Limits, Privacy, and Quality Traps to Plan For
- Your 30-Day Social Media Analysis Plan
Why Native Dashboards Stop Being Enough
Native dashboards are excellent at answering questions about one account inside one platform. A social manager can inspect impressions, reactions, comments, video views, or follower movement and make a quick publishing decision. The trouble starts when the question changes from “How did this post perform?” to “Did the same audience respond to this topic across platforms, and did the response change brand risk?”
Suppose a team compares a campaign's Instagram and YouTube results. One dashboard reports reach, another emphasizes views, and a third exposes a different definition of engagement. Even if all three interfaces are accurate within their own systems, the combined report can become misleading because the underlying measurements don't share a common denominator. A social media dashboard guide can help teams think about reporting needs, but a dashboard alone won't solve inconsistent schemas or missing history.
The questions dashboards can't answer
The engineering workload grows when the team needs any of the following:
- Cross-platform comparison: Compare normalized performance rather than platform-native totals.
- Historical backfills: Reconstruct a consistent dataset after a campaign or incident has already ended.
- Conversation context: Join a post to its replies, quoted content, author metadata, and related hashtags.
- Competitive benchmarking: Estimate competitor momentum using only the fields each platform makes available.
- Machine consumption: Pass clean records into a feature store, vector index, or training corpus.
- Reproducible analysis: Run the same query against the same snapshot and obtain an auditable result.
First-party tools also impose practical boundaries. Their schemas are closed, their retention windows vary, and some fields are sampled, delayed, aggregated, or unavailable for other accounts. A chart may show the current value without giving you the raw events needed to explain how that value was produced.
Practical rule: If a metric will influence a model, store the raw event, the source timestamp, the retrieval timestamp, and the formula used to derive the metric.
The answer isn't to discard native analytics. Keep it as a source of platform-specific truth and operational feedback. Add an exportable data layer when the team needs joins, backfills, normalization, or downstream automation. Once the question becomes more interesting than a total, queryable records beat attractive charts.
What Social Media Data Actually Is
Start with the raw material, not the model. Social media data includes posts, comments, replies, reactions, shares, saves, media objects, timestamps, author or account metadata, profile details, and relationships such as mentions, follows, reposts, and reply edges. A single post is an event, but a conversation is a connected collection of events.
Your ingestion model should distinguish source fields from derived signals. A source field might be a post identifier, published time, platform, text, author identifier, reaction count, or media URL. A derived signal might be sentiment probability, topic assignment, engagement rate, language label, embedding, bot-risk score, or graph centrality. Store both. If you overwrite raw values with transformed ones, you lose the ability to audit or recalculate.
Four metric families
A practical social analytics warehouse can organize signals into four families:
| Metric Family | Underlying Data | Example Question | Example Derived Field |
|---|---|---|---|
| Engagement | Reactions, comments, shares, saves, views, clicks, impressions | Did people interact with this content? | Normalized engagement rate |
| Sentiment | Text, reply context, labels, language, classifier output | How do people feel about the topic? | Polarity and confidence |
| Topical | Text, hashtags, captions, transcripts, embeddings | What themes are audiences discussing? | Topic ID or topic distribution |
| Network | Authors, mentions, replies, reposts, follows, hashtags | Who connects ideas and communities? | Degree, PageRank, or community ID |
The same word doesn't mean the same observation everywhere. A “view” can have a different counting rule from one platform to another. A short reply may carry more context when attached to a thread, while an isolated post may be ambiguous. Character limits, audience norms, recommendation systems, and available metadata all change the meaning of a record.
Collection also affects what you can infer. A streaming source can deliver events as they arrive, while a pull-based API requires repeated queries and careful checkpointing. Neither is automatically better. Streaming demands resilient consumers and replay logic. Pull-based collection demands pagination, rate-limit handling, and a strategy for missed intervals.
Teams choosing their collection layer may benefit from a practical comparison of AI scraping tools for engineers, especially when they need to weigh API access, extraction reliability, and downstream data handling. The important design decision is not “Which tool has the most fields?” It's “Which fields can we collect consistently, legally, and reproducibly for the question we need to answer?”
Engagement Metrics That Survive Cross-Platform Comparison
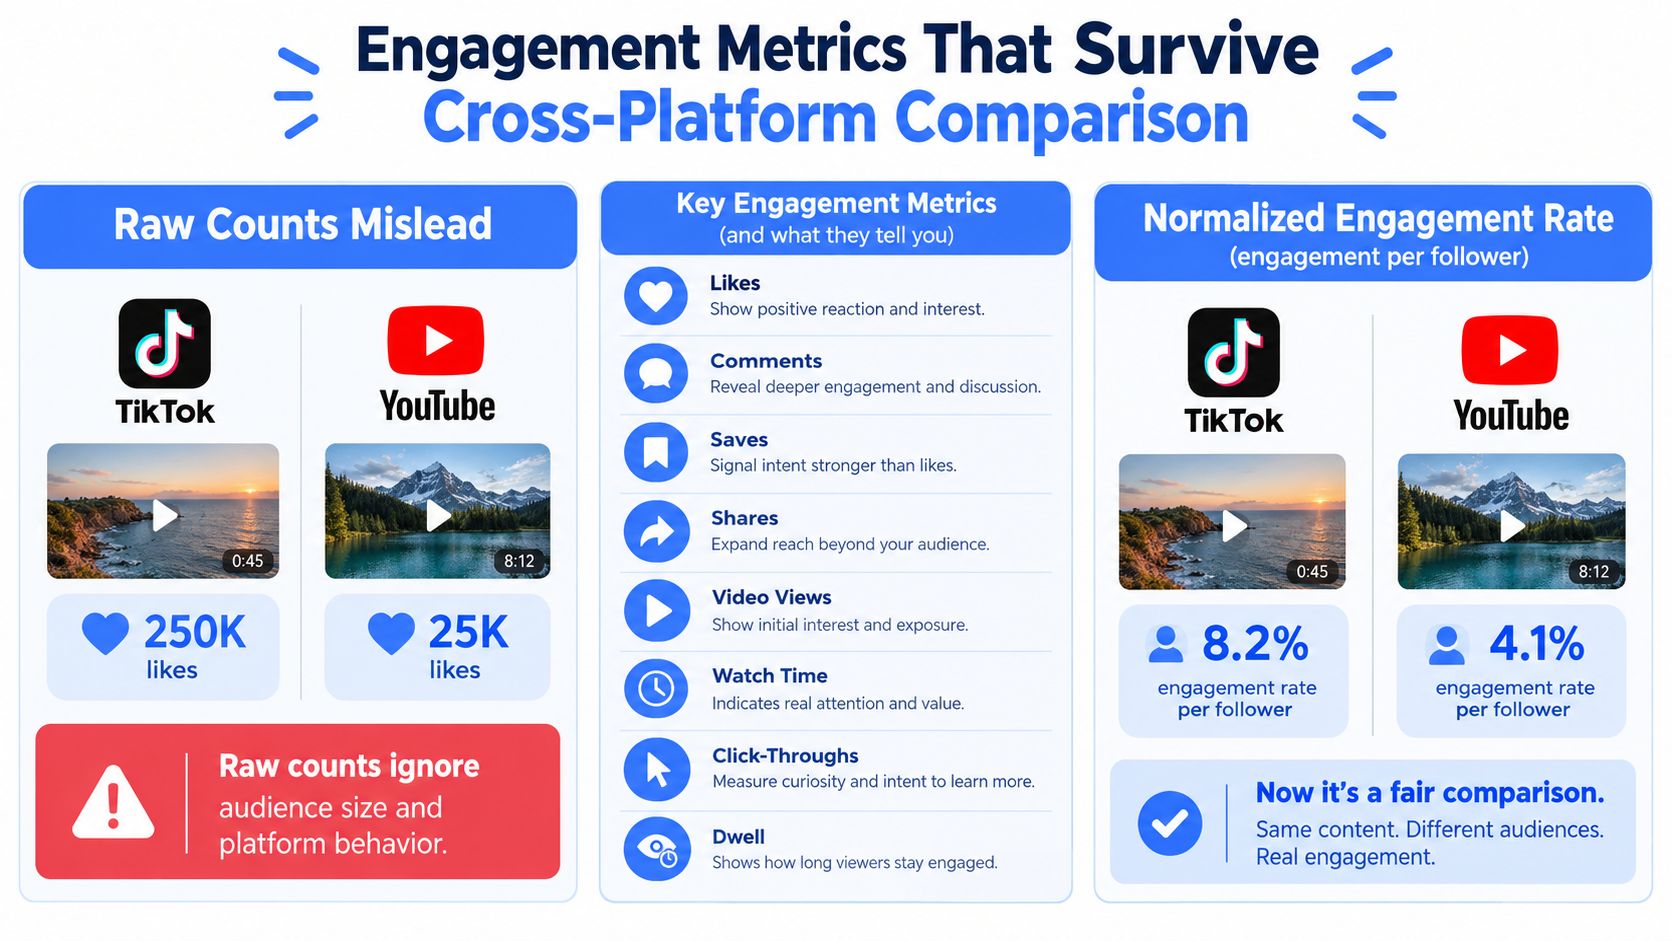
Raw counts are useful for operational monitoring, but they're weak training features and poor cross-platform benchmarks. A post with many likes may just have a larger reachable audience, a different recommendation surface, or a platform culture that encourages lightweight reactions. Compare the count without exposure or audience context, and the model learns platform behavior instead of content performance.
Academic work groups engagement measurement into quantitative metrics, normalized indexes, sets of indexes, and qualitative metrics. It also shows that behavioral proxies are the most common way to operationalize engagement. The academic review of social media engagement metrics is especially useful because it demonstrates that formulas differ by platform. X commonly uses interactions divided by impressions, LinkedIn may combine interactions and clicks with followers relative to impressions, and YouTube can use interactive clicks relative to ad impressions.
Keep the raw layer, compare the normalized layer
For every post, preserve fields such as:
- Raw actions: likes, comments, saves, shares, clicks, views, and watch time.
- Exposure: impressions or another platform-provided denominator.
- Audience context: followers, subscribers, or reachable audience where available.
- Derived rates: engagement per impression, engagement per follower, and click-through rate.
- Quality indicators: reply depth, save-to-like ratio, watch completion where available, and retrieval timestamp.
A simple normalized rate is:
engagement_rate = (likes + comments + shares + saves + clicks) / impressions
Don't assume that formula is valid everywhere. Define a platform adapter that maps native fields into a shared semantic layer, then records which denominator was used. The formula should be a versioned transformation, not an undocumented dashboard calculation.
A worked comparison
Assume three posts have different raw counts and different exposure levels:
| Platform | Total Interactions | Impressions | Normalized Rate |
|---|---|---|---|
| Platform A | 5,000 | 100,000 | 5% |
| Platform B | 2,000 | 20,000 | 10% |
| Platform C | 8,000 | 400,000 | 2% |
Platform C wins on activity but loses on interaction efficiency. Platform B has the strongest rate despite producing fewer actions. Those are different business conclusions, and both can be correct.
A weighted index can add business meaning, but document the weights. For example, a save or qualified click may matter more to a consideration goal than a like. Don't hide that judgment inside a dashboard. Keep the unweighted actions available so an analyst can test alternative definitions later.
Comment count has another trap. Ten comments can represent ten isolated reactions or a deep conversation with replies, questions, and follow-ups. Store thread structure and reply depth when access allows. For model training, raw and normalized values should travel together. The raw field preserves scale, while the normalized field supports comparison and forecasting.
Sentiment, Topic Modeling, and Network Analysis Compared
These methods answer different questions, so combining them doesn't mean applying the same model to every record. Sentiment classifies attitude, topic modeling organizes meaning, and network analysis explains relationships. A crisis monitor that uses only volume-weighted sentiment can miss a small but influential community, while a network graph without text cannot explain what that community is discussing.
Choose the method from the decision
| Method | Question Answered | Technique Options | Typical Tools | Strengths | Watch Out For |
|---|---|---|---|---|---|
| Sentiment analysis | How do people feel about a brand, feature, or event? | Lexicons, classical ML, transformer or LLM classifiers | VADER, scikit-learn, Hugging Face | Produces polarity, intensity, and confidence signals | Sarcasm, negation, code-switching, and missing context |
| Topic modeling | Which themes appear without predefined labels? | LDA, BERTopic, Top2Vec, embedding clustering | Gensim, BERTopic, sentence-transformers | Surfaces unexpected themes and vocabulary | Topic drift, short texts, and unstable cluster labels |
| Network analysis | Who connects, repeats, amplifies, or bridges information? | Community detection, centrality, graph learning | NetworkX, GraphSAGE, graph databases | Reveals communities and information flow | Missing edges, private activity, bots, and sampling bias |
Sentiment needs more than a text column. Include the parent post, conversation position, language, media context, and ideally a human-labeled evaluation set. Classical pipelines can remain competitive when feature extraction matches the classifier. One review reports that part-of-speech features were particularly suitable with SVM and Naive Bayes on social-media datasets, while applied work using an ERNIE-based model on Weibo reported 89.51% accuracy on its stated training, validation, and test sets, as described in the review of sentiment-analysis approaches. Treat that result as evidence of domain adaptation, not as a universal score for your data.
Topic modeling works best when the team wants discovery rather than a fixed taxonomy. Use topic labels as exploratory artifacts first. Review representative posts, merge duplicate themes, and track topic meaning over time because an identifier from one training run may not represent the same concept after a retrain.
Network analysis starts with edges. A mention, reply, repost, shared hashtag, or co-occurring URL can become a relationship, but each edge type should remain distinct. Use centrality to find structurally important accounts, community detection to find clusters, and text analysis to interpret them. For a practical introduction to social sentiment analysis, focus on how classification supports a decision rather than treating positive and negative labels as the final answer.
An End-to-End Analysis Workflow With Sample Queries
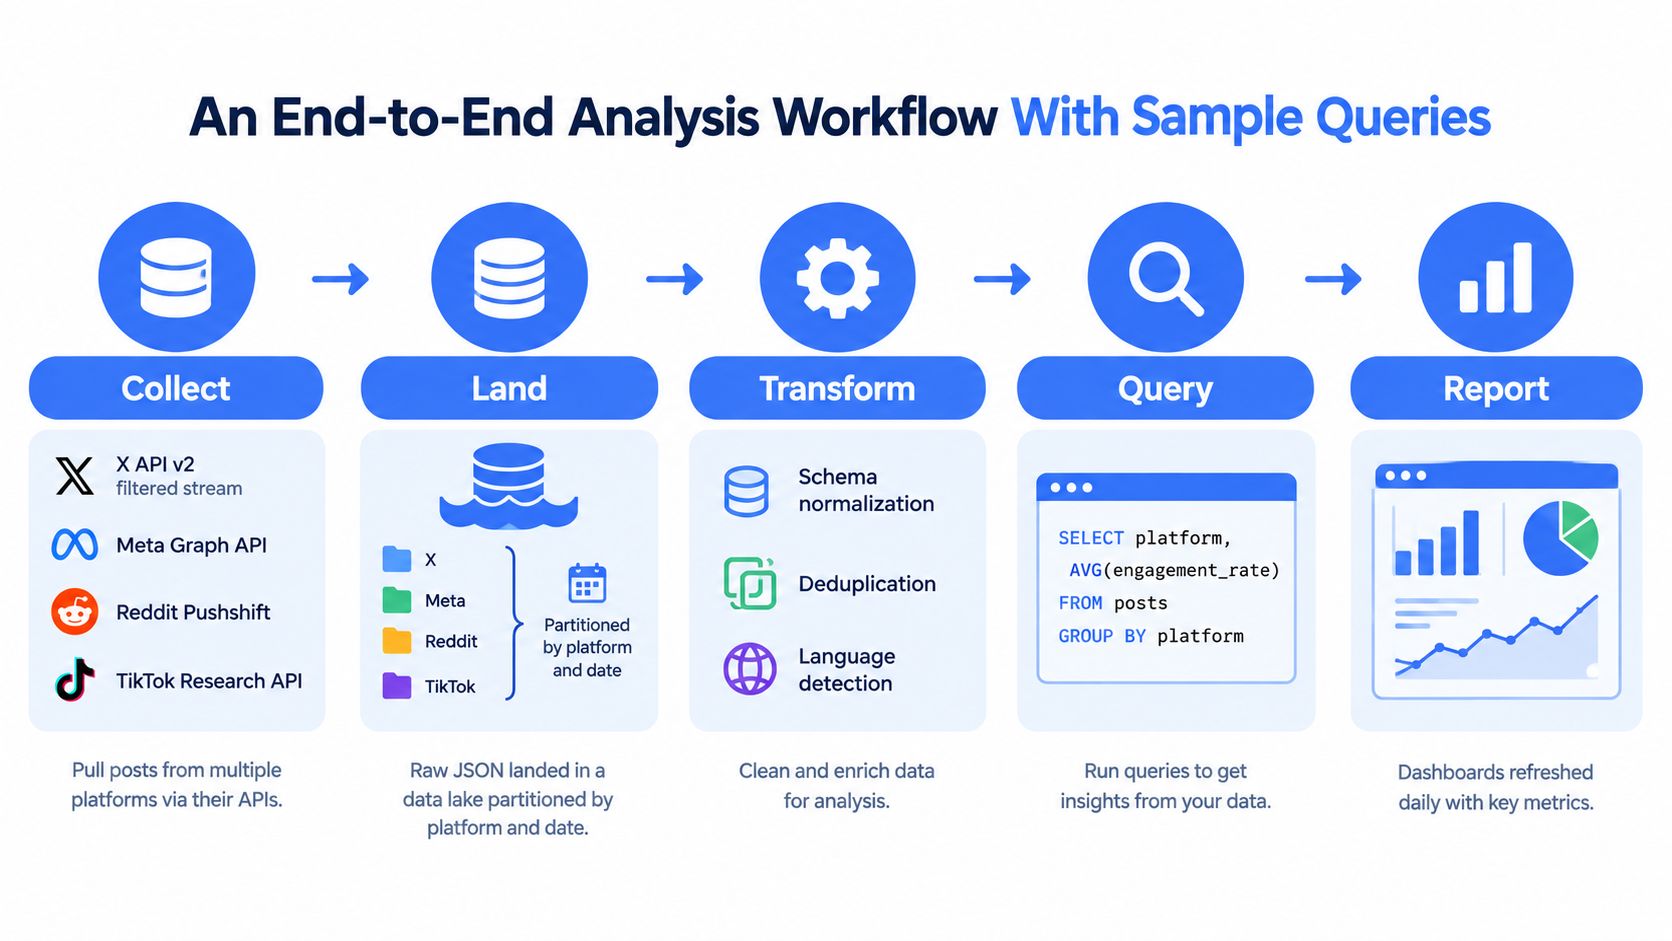
A production pipeline should make the path from source event to business insight visible. Collect records, land immutable raw data, normalize the schema, enrich the records, query the result, and expose only the appropriate outputs to dashboards or ML systems.
Collect and land raw events
Use approved platform APIs or compliant extraction services for the platforms in scope. Depending on access and use case, a collector may work with an X filtered stream, Meta Graph API, Reddit Pushshift, or TikTok Research API. The collector should write the original response to object storage and publish a normalized event to Kafka or another queue when near-real-time processing matters.
A simplified Python pattern looks like this:
for event in client.stream(query): if event.id in seen_ids: continue try: write_raw(event, partition=event.platform + "/" + event.published_date) publish_normalized(normalize(event)) except RateLimitError as error: sleep(error.retry_after) checkpoint(event.cursor)
The exact client differs by platform. The engineering principles don't: use idempotency keys, persist cursors, retry transient failures, and never acknowledge an event before the raw payload is durable.
Transform and query
Normalize common fields such as platform, post_id, author_id, text, published_at, retrieved_at, impressions, and interaction counts. Keep platform-specific fields in a nested payload instead of forcing every source into a lossy flat table. DuckDB works well for local inspection of Parquet files:
SELECT p.platform, p.post_id, u.account_type, p.published_at, p.textFROM read_parquet('lake/posts/**/*.parquet') AS pLEFT JOIN read_parquet('lake/users/**/*.parquet') AS u ON p.platform = u.platform AND p.author_id = u.author_idWHERE p.published_at >= DATE '2026-01-01';
A warehouse query can calculate a post-level rate and compare it within a platform and publishing day:
WITH scored AS ( SELECT platform, post_id, published_at, (likes + comments + shares + saves + clicks) / NULLIF(impressions, 0) AS engagement_rate FROM posts), ranked AS ( SELECT *, AVG(engagement_rate) OVER ( PARTITION BY platform, DATE(published_at) ) AS daily_platform_average FROM scored)SELECT * FROM ranked;
A dbt model for daily brand mentions should define its inputs, freshness expectations, and tests. The model can select records where a normalized brand entity appears, group by platform and calendar date, and expose mention_count, negative_share, unique_author_count, and topic aggregates. Don't treat a dbt model as a one-off SQL file. Version the definition so a future analyst knows which brand dictionary and sentiment model produced each output.
For broader marketing context, master marketing data analysis provides a useful reminder that social signals become more valuable when teams connect them to other decision data rather than reporting them in isolation. Before production, also document schema evolution, deduplication keys, late-arriving events, timezone normalization, and the exact source snapshot used for every training dataset. Guidance on data pipeline automation can help teams formalize those operational patterns.
Feeding Analysis Results Into RAG and ML Pipelines
A sentiment score or topic label isn't a finished product. It's an observation that can support retrieval, classification, forecasting, or human review. The team should preserve the original text and conversation context so downstream systems can inspect evidence instead of trusting a derived label blindly.
Build retrieval records around conversations
For RAG, chunk by meaning rather than by arbitrary character length. A single post may be an adequate document when it stands alone. A complaint with replies should usually become a thread record containing the root post, selected replies, timestamps, platform, topic, sentiment evidence, and source identifiers.
| Data Type | Chunking Strategy | Embedding Choice | Downstream Use |
|---|---|---|---|
| Standalone post | One post with metadata preserved | General text embedding | Brand or topic retrieval |
| Reply thread | Root post plus bounded reply context | Domain-tuned text embedding | Support and reputation analysis |
| Video transcript | Segment by topic or speaker change | Text embedding with time metadata | Video question answering |
| Topic cluster | Summarized cluster plus representative posts | Embedding for summary and source records | Trend exploration |
| Author or community profile | Separate profile document, never mixed invisibly with posts | Profile or graph representation | Community-aware retrieval |
Store embeddings in pgvector, Pinecone, Milvus, or a comparable vector system, but use metadata filters before similarity ranking. A retrieval query might require platform = 'youtube', a recent published_at range, a minimum normalized engagement rate, and an author_verified flag where that field is legitimately available. Filters reduce irrelevant matches and stop a highly similar historical post from dominating a current-risk question.
A grounding prompt can be explicit:
Answer only from the retrieved social records. Separate observed statements from inference. Cite each material claim with platform, post_id, and published_at. If the records conflict or lack evidence, say so. Do not infer a user's identity beyond the supplied metadata.
That prompt doesn't replace evaluation. Test retrieval against known questions, inspect false positives, and check whether deleted or stale content remains discoverable under your retention policy. Practical data transformation techniques are relevant here because chunking, metadata normalization, and lineage determine whether the vector index remains useful.
Turn analysis into features
For supervised ML, create a feature table rather than passing model-generated prose directly into training. Useful columns may include normalized engagement, sentiment probabilities, topic distributions, reply depth, author-level activity aggregates, community identifiers, and temporal lag features. Store them in Parquet with a schema, owner, source version, and transformation code.
Version datasets with DVC or lakeFS, and record the classifier, embedding model, topic configuration, and extraction timestamp. A forecast should know whether a feature was available at prediction time. Otherwise, a future engagement count or a post-publication sentiment label can leak into the past and make evaluation meaningless.
Treat analysis outputs as features with uncertainty, not ground truth. Sentiment confidence can become a feature, while the raw text remains available for review. Topic membership can support demand forecasting, while a human-approved label may be required for fine-tuning. Graph features can identify structural change, but they shouldn't automatically determine which individual accounts receive action.
Access Limits, Privacy, and Quality Traps to Plan For
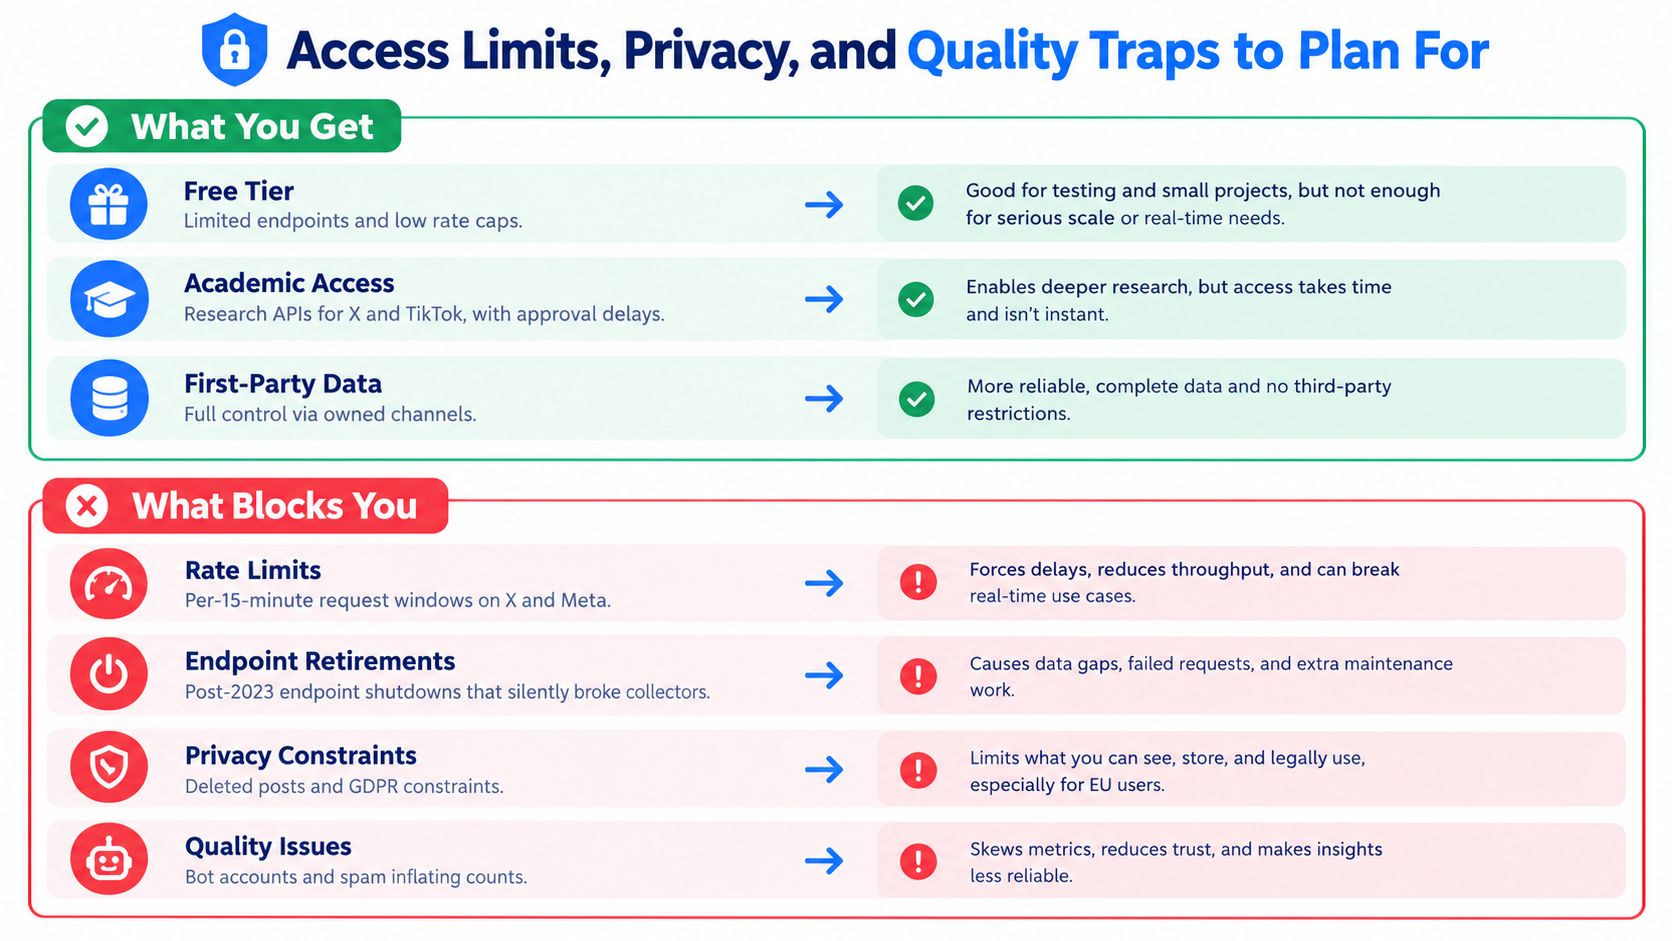
More posts don't automatically produce a better model. A large collection with duplicated reposts, bot amplification, missing replies, inconsistent timestamps, or weak consent controls can poison both retrieval and training.
Access changes can break collectors without changing your application code. X, Meta, TikTok, and Reddit expose different fields, quotas, approval paths, and historical coverage. Endpoints can be restricted or retired, so a connector needs health checks that detect an empty response, unexpected schema, or sudden drop in event volume instead of marking the run successful.
Privacy needs a design decision before ingestion. Minimize user identifiers, restrict access to sensitive fields, define deletion handling, and check whether your use complies with platform terms, GDPR, the Digital Services Act, and any research or organizational review requirements. Public visibility doesn't eliminate contextual privacy expectations, and exporting user-generated content into a vector database can increase its exposure.
Use a verification protocol before promoting outputs:
- Backtest known events: Confirm that the pipeline detects events your team can independently identify.
- Sample-label records: Have reviewers check sentiment, topic, language, and relevance across platforms.
- Measure drift: Monitor changes in vocabulary, source mix, missingness, and score distributions.
- Test deletion paths: Remove records that should no longer be retained from raw, warehouse, and vector layers.
- Audit amplification: Compare unique authors and conversation structure rather than trusting total interactions.
Sarcasm, code-switching, spam, and timezone drift are modeling problems and data-quality problems. Put them in the test set, not in a footnote.
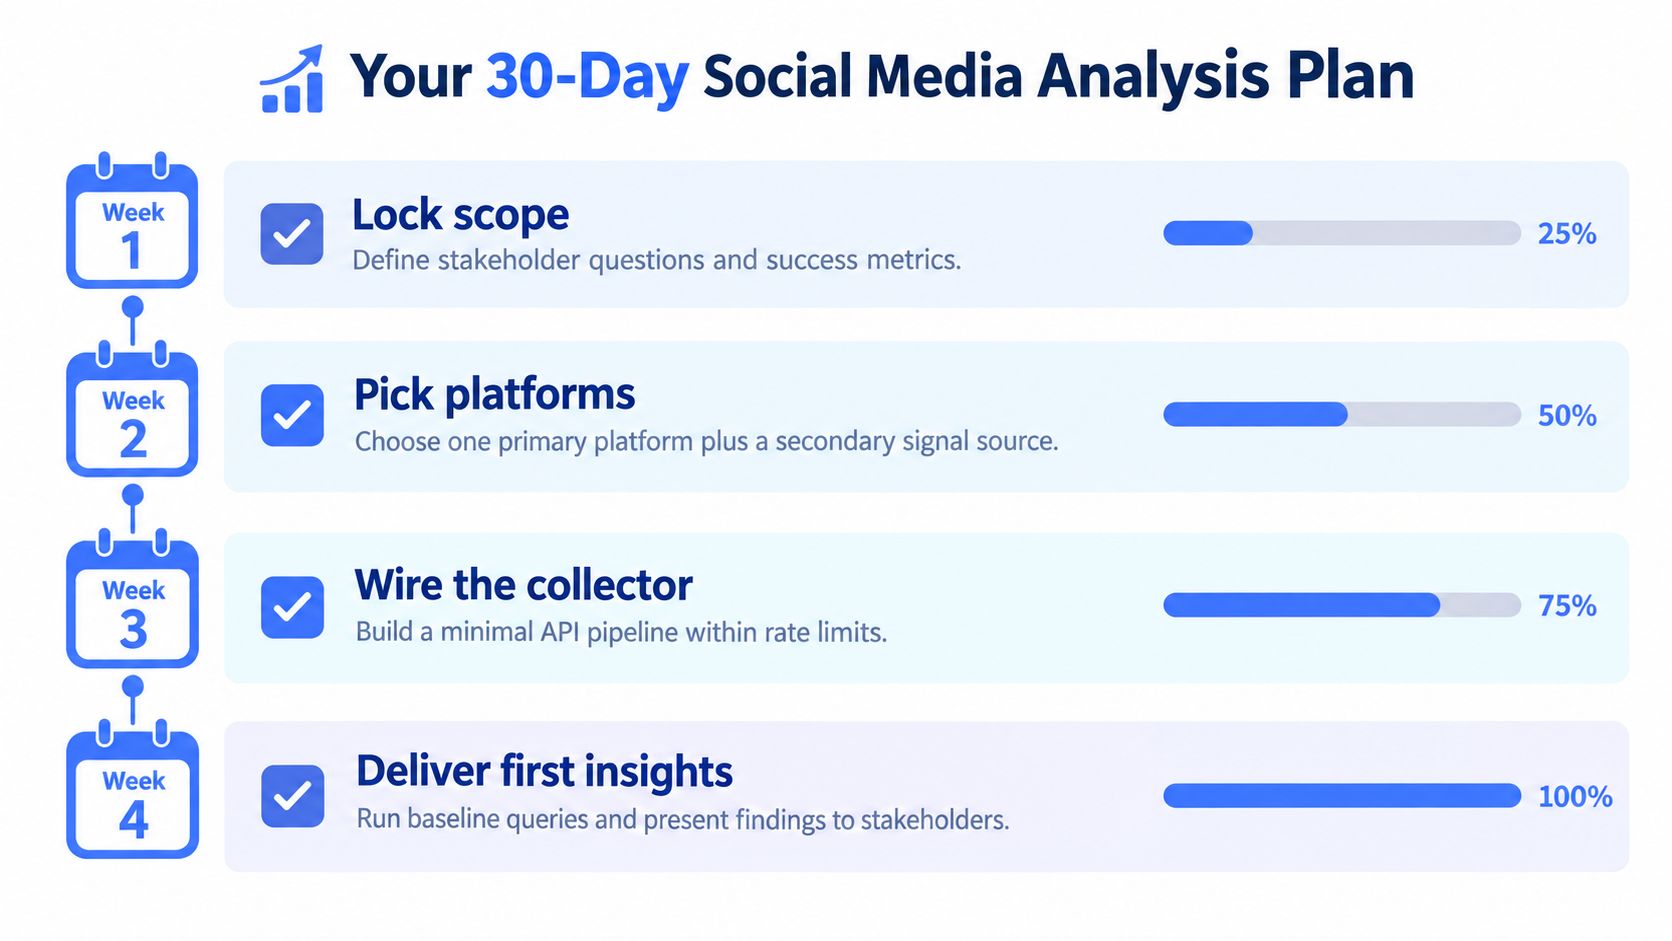
Your 30-Day Social Media Analysis Plan
A small team can build a credible first version without collecting every available signal. Start with one decision, one primary platform, and one secondary source that adds context.
Week 1
Lock scope. Write the stakeholder question, the business action it should inform, the platform fields required, and the success metric. Define retention, privacy, and deletion rules before the first API call.
Week 2
Pick platforms and schemas. Choose the primary source, map its fields to a shared record, and identify which metrics can be normalized. Create raw and enriched warehouse tables with platform-specific fields preserved.
Week 3
Wire the collector. Add pagination or stream checkpoints, idempotent writes, retries, schema validation, and monitoring for missing or unexpectedly empty responses. Run a small baseline for engagement, sentiment, topics, and one network relationship type.
Week 4
Deliver first insights. Compare normalized performance, review sentiment errors, inspect representative topics, and validate whether the network view changes a decision. Only after that review should you publish records to a RAG index or freeze a fine-tuning dataset.
By the end of the rollout, you should have a source contract, raw event storage, normalized queries, labeled evaluation samples, documented feature definitions, and a reproducible dataset snapshot. That foundation matters more than adding another dashboard before the first pipeline is trustworthy.
Captapi provides a developer-focused REST API for structured public data from YouTube, TikTok, Instagram, and Facebook, including comments, transcripts, summaries, search results, and engagement fields that can feed the collection and enrichment layers described here. If you want to reduce custom connector work while building a social media analysis pipeline, visit Captapi and evaluate its endpoints against your platform, privacy, and reproducibility requirements.