
8 Engagement Metrics Facebook Marketers Should Track

Likes and reach are useful, but neither can deliver a complete performance verdict. A post can reach many people and prompt little action, or attract fewer viewers while generating a valuable discussion, meaningful clicks, and strong audience retention. The right engagement metrics Facebook marketers track depends on the decision they need to make: who saw the content, who reacted, who joined the conversation, who amplified it, who clicked, and whether a video held attention.
Facebook's scale makes this distinction more important. Industry summaries reported roughly 3.07 to 3.12 billion monthly active users in 2026, while Meta's newer reporting framework used a combined Family Daily Active People figure that reached 3.60 billion in June 2026. Because Facebook-only audience disclosures changed after 2023, historical comparisons require care. The underlying benchmark summary also reports a 0.15% average Facebook engagement rate for 2026, but that figure isn't directly interchangeable with every other benchmark.
The eight metrics below use one consistent framework: define the denominator, separate visibility from interaction, segment by format and distribution source, then inspect the quality of the response. Developers and teams that need repeatable public-data collection can use a tool such as Captapi to support competitive and content analysis workflows, while retaining responsibility for lawful data handling.
Table of Contents
- 1. Engagement Rate
- 2. Reach
- 3. Click-Through Rate
- 4. Comment Count and Sentiment
- 5. Share Count
- 6. Video Views and Average Watch Time
- 7. Impressions and Impressions by Type
- 8. Reaction Breakdown
- Facebook Engagement Metrics: 8-Point Comparison
- Turn Eight Metrics Into One Measurement System
1. Engagement Rate
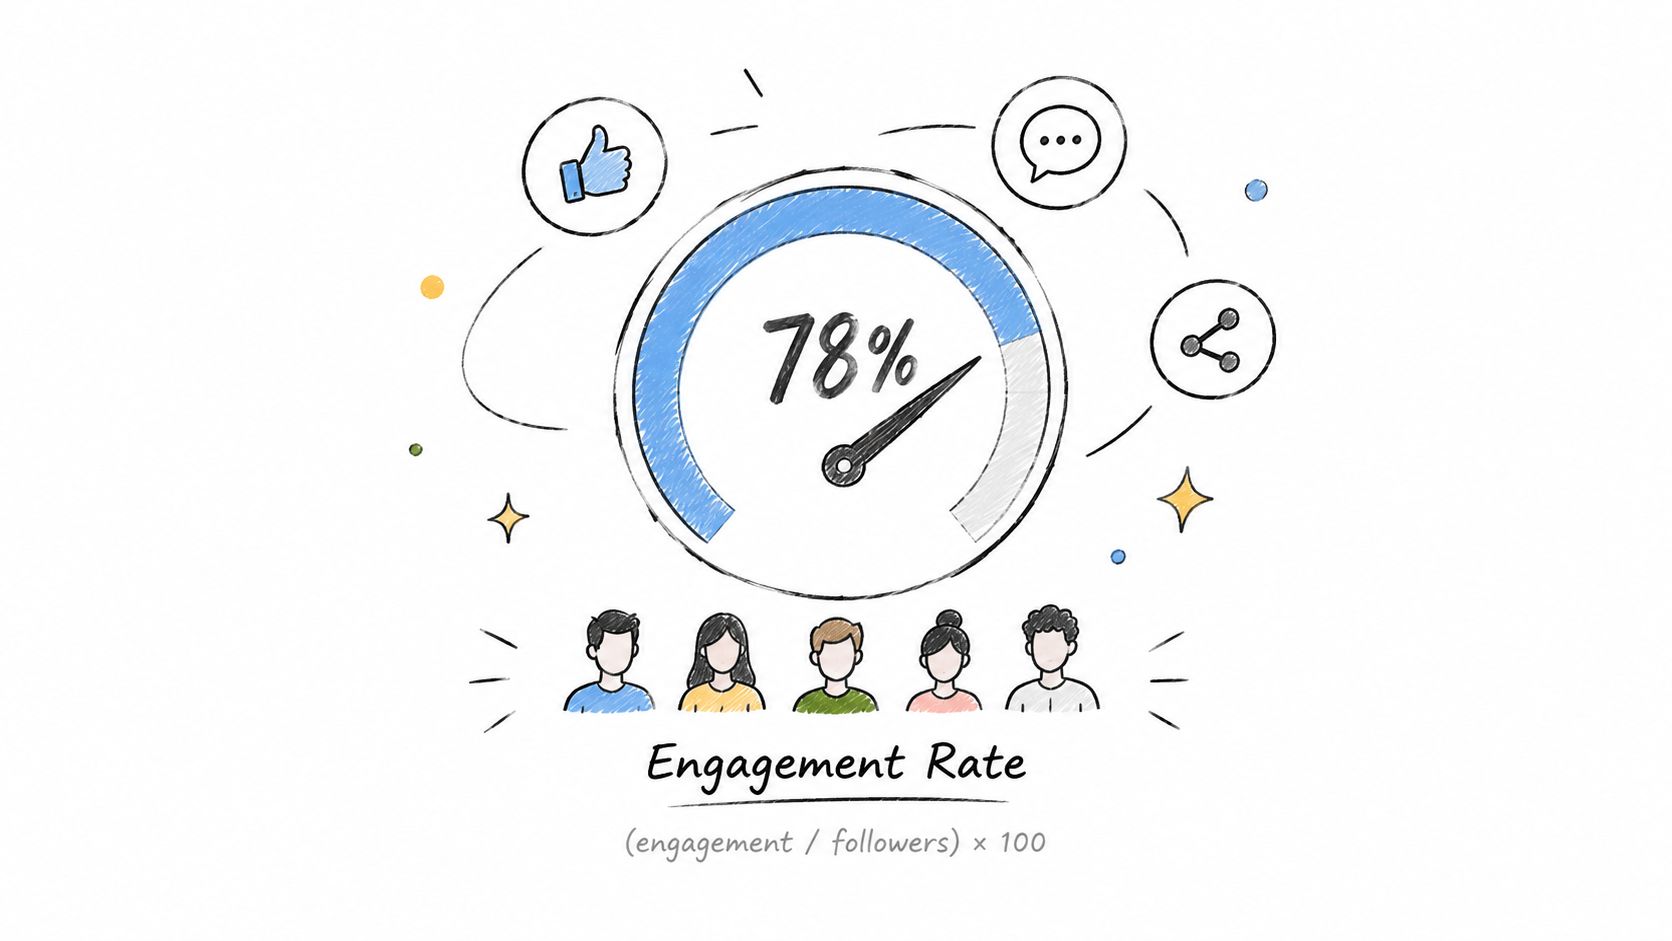
Engagement rate answers a broad question: how much interaction did a post generate relative to the audience base you selected? A common follower-based formula is (total engagements ÷ total followers) × 100, with engagements including reactions, comments, and shares. Reach-based and impression-based versions answer different questions, so a report should always name its denominator.
That distinction explains why published Facebook benchmarks vary sharply. One 2025 benchmark reports Status posts at 0.20%, Reels at 0.18%, Album posts at 0.18%, Image posts at 0.15%, and Link posts at 0.05%, while a separate Buffer dataset reports a 3.6% median engagement rate. These aren't necessarily contradictory. They use different datasets and measurement frames, as shown in Facebook benchmark comparisons from Socialinsider.
Choose the denominator before comparing
A follower-based rate is convenient for a page-level dashboard, but it can understate or overstate a post's response because followers aren't identical to people who saw it. Reach-based engagement is more useful for evaluating exposure that took place. Impression-based engagement is appropriate when you want to understand how often displayed content produced interaction, including repeat visibility.
For a competitor workflow, store the numerator components separately rather than saving only one blended rate. A marketing agency could compare a product announcement with other announcement posts, then use exported comments to distinguish genuine discussion from short acknowledgements. Captapi's guide to Facebook engagement provides relevant context for defining those actions.
Practical rule: Never label a rate “good” until the report states whether it uses followers, reach, or impressions.
Track a trend over a meaningful reporting window instead of reacting to one unusual post. Compare like with like, such as Reels against Reels or link posts against link posts. For agencies building broader reporting systems, this can sit alongside agency social media management software, provided the underlying formulas remain visible.
2. Reach
Reach measures unique users exposed to content. It supports a visibility decision, not an interaction decision. If a post reached a large audience but generated few reactions, comments, shares, or clicks, the distribution worked better than the message. If reach is low and interaction among exposed users is strong, the creative may be resonating with a narrow audience while distribution remains limited.
Keep reach separate from impressions. Reach counts distinct people in the selected reporting frame, while impressions count displays, so one person can contribute more than one impression. That difference lets analysts detect repeated exposure. A campaign may have stable reach but rising impressions, which could mean the existing audience is seeing the content more often rather than new people discovering it.
Use reach to diagnose distribution
For owned content, compare organic and paid reach where the platform makes those fields available. A sudden increase in paid reach can explain higher total exposure without proving that the content earned stronger organic distribution. For public competitor analysis, treat reach estimates cautiously because available public data may not expose the same page-level fields that an owner sees in its native reporting.
A practical scenario is an algorithm-change review. An agency can compare a page's organic reach across comparable content formats before and after a publishing change, then pair that result with engagement rate. If reach falls while the rate remains stable, the content may still satisfy the people who see it. If both decline, the team has a stronger reason to investigate format, topic, or audience fit.
- Compare unique exposure: Use reach to ask how many people encountered the content.
- Separate distribution sources: Don't treat paid exposure as evidence of organic traction.
- Pair with interaction: Calculate engagements relative to reach to estimate response among exposed users.
- Watch audience scale: A large page and a small page can produce different absolute reach patterns even when their content quality is similar.

Reach is therefore a useful first diagnostic, but it can't tell you whether viewers cared. A post needs interaction, action, or retention metrics to explain what happened after exposure.
3. Click-Through Rate
Click-through rate, or CTR, measures how often an impression produces a defined click. Calculate it as (total clicks ÷ total impressions) × 100. Unlike engagement rate, which captures interaction on Facebook, CTR evaluates whether a displayed message moves users toward a destination or next step.
Define the click event before comparing posts. A link click, button click, profile visit, and outbound website session represent different actions. Combining them can produce a favorable-looking rate while hiding whether users reached the site. Use tagged URLs, then reconcile Facebook click data with analytics from the destination.
CTR supports the action decision in a Facebook measurement system. A research-report campaign, for example, might compare posts with similar reach. The post receiving fewer reactions could still create more qualified website visits. A high CTR does not prove conversion, satisfaction, or content quality. Visitors may click because the offer is appealing, then leave because the landing page is slow, unclear, or poorly matched.
Captapi's content engagement metrics guide can inform a measurement model that records clicks alongside reactions, comments, and shares. Keep click type, impression basis, format, audience source, and destination outcome in separate fields.
Interpret the combinations rather than CTR alone:
- High impressions, low CTR: visibility is strong, but the promise or call to action may not match audience intent.
- Low impressions, high CTR: exposed users respond to the message, while distribution remains limited.
- High CTR, weak downstream sessions: compare the creative promise with landing-page speed, clarity, and relevance.
- Strong comments, weak CTR: the post may support conversation more effectively than traffic generation.
Use UTM parameters and a consistent attribution window. Compare like with like: a link post's CTR should not be treated as equivalent to a video view-through action unless both answer the same business question. Pair CTR with reach to separate distribution from response, and with downstream sessions to test whether clicks become meaningful visits.
4. Comment Count and Sentiment
Comment count measures how many replies a post receives. Sentiment analysis classifies those replies by apparent emotional direction, such as positive, negative, or neutral. These metrics support different decisions: comment volume indicates conversation, while sentiment helps assess the conversation's tone. Neither metric independently proves approval, satisfaction, or business value.
A high count can reflect enthusiasm, confusion, dissatisfaction, support requests, or controversy. A smaller discussion may contain detailed objections that matter more to product, sales, or customer-service teams than many brief affirmations.
Read the content behind the count
Build a comment dataset with timestamps, parent relationships, available reactions, and post context. Review automated sentiment labels against a sample of the original text before using them for decisions. Sarcasm, regional wording, jokes, coordinated replies, and repeated support complaints can produce misleading classifications.
For a practical comparison, a brand-monitoring team might examine comments on a competitor's product announcement and its own. Compare recurring topics, not only reply totals. Requests for missing features, delivery concerns, or the language customers use to describe a problem can guide product messaging, support documentation, and future content.
Use these measures for distinct checks:
- Comments per post: Compare conversation volume across similar formats, audiences, and reach.
- Sentiment by comment: Treat the label as a review signal, then verify ambiguous or high-impact replies manually.
- Topic frequency: Group repeated questions and objections into content or service themes.
- Qualified reply rate: Mark comments that contain a specific question, problem, or recommendation, then compare them with total comments.
Captapi's Facebook comment search workflow can support public comment collection for suitable research and monitoring tasks. Before automating collection, document consent, platform rules, retention limits, and access controls.

Interpret the combination. Rising comments with increasingly negative themes may indicate a response problem even if overall engagement improves. Moderate discussion with constructive questions may show stronger relationship value than a post dominated by one-click reactions. Pair sentiment with reach and downstream actions to distinguish a widely visible complaint from a concentrated issue, and separate emotional response from conversation quality.
5. Share Count
Share count records how often users distribute a post to their timelines, pages, or groups, subject to the visibility available in the reporting environment. It measures amplification, meaning content movement into another audience or context. A reaction signals immediate response; a share creates an opportunity for additional exposure.
A high share count does not establish approval. Users may share content because it is useful, entertaining, controversial, locally relevant, or worth criticizing. Public totals may also exclude downstream audiences that viewed a shared post. Treat shares as evidence of distribution behavior, not guaranteed reach, sentiment, or conversion.
Link amplification to a decision
Use shares relative to reach or total engagements to compare posts with different audience sizes. Then inspect comments on the original and shared posts when available. A high share-to-engagement ratio indicates that distribution contributed meaningfully to performance, but it does not identify the motive. The post may solve a practical problem, express identity, document a local event, or provoke disagreement.
A nonprofit's explainer about a community issue may receive reactions from people who recognize the topic, while shares show an intention to place the information before others. A commercial post can generate many reactions and few shares because users enjoy it without recommending it. The first pattern supports broader information distribution; the second may support creative refinement rather than amplification.
Analyze the metric through three comparisons:
- Format: Compare educational, announcement, entertainment, and promotional posts separately.
- Timing: Investigate sudden increases alongside external events, collaborations, or group discussions.
- Response quality: Read replies on shared posts to classify amplification as supportive, critical, or necessary.
Use the result to choose between repurposing an idea and examining distribution channels. For example, widespread sharing with little site traffic may mean users consume the information inside Facebook. Shares combined with qualified clicks provide stronger evidence of both amplification and action. Pair the measure with reach to estimate visibility, comments to assess conversation, and sentiment to avoid treating controversy as advocacy.
6. Video Views and Average Watch Time
Video views count recorded plays according to the platform's selected definition. Average watch time measures how long viewers watched on average before leaving or reaching the end. Views indicate viewing volume. Watch time indicates retention, so neither metric alone proves that a video performed well.
A high view count can conceal weak attention. Short clips may collect many starts but lose viewers quickly, while longer explanations may attract fewer starts and hold attention among those who continue. Compare videos with similar lengths, formats, audiences, and reporting definitions. Separate organic and promoted delivery when those fields are available.
Use retention to identify the decision the metric can support: whether the video's packaging and content sustain attention. A retention curve shows where viewing changes. Match each drop-off point with the transcript, visuals, captions, and pacing. Early exits during the introduction suggest that the opening needs a clearer promise or faster delivery. A decline when technical material begins may indicate unclear framing, insufficient examples, or excessive complexity. Average watch time locates the outcome, while the curve and content review help assess the cause.
A marketing agency comparing competitor Reels could collect public video details, transcripts, and visible engagement fields, then classify opening hooks and narrative structures. Captapi's video engagement metrics resource can support a workflow that combines these fields without turning one measure into a quality verdict.
For analysis, apply four checks:
- Separate starts from retention: Compare views with average watch time and the retention curve. More starts do not establish deeper viewing.
- Compare similar videos: Evaluate a short promotion against comparable short promotions, not a long tutorial, unless the question concerns format performance.
- Review the opening: Examine the first retention decline alongside the hook, thumbnail, title, and initial visuals. The pattern signals where to investigate, not the exact cause.
- Pair retention with response: Read comments for evidence that viewers found the video useful, confusing, or contentious.
A transcript makes the result actionable. Compare high-retention sections with their wording, examples, and pacing, then test those patterns in new videos.
Apply conclusions within the same audience and distribution context. Paid viewers, followers, and recommendation traffic may arrive with different expectations, so a retention pattern from one source should not automatically guide another.
7. Impressions and Impressions by Type
Impressions measure how many times Facebook displayed content, including repeat displays to the same person. They therefore describe visibility, not the size of a unique audience. Reach counts distinct exposed users, while impressions reveal how often those users encountered the content during the reporting period.
Use the available breakdown by paid, organic, and viral or recommendation-related sources to connect visibility with distribution decisions. Two posts can record similar totals for different reasons: paid delivery may create most displays for one, while shares and other audience activity may generate fewer but more organic impressions for another.
Read frequency before judging performance
Divide impressions by reach to estimate repeat exposure. A higher ratio may result from deliberate frequency, repeated feed opportunities, or a smaller audience receiving the content more often. The ratio alone does not prove fatigue or suppression.
A campaign manager deciding whether to reallocate budget should compare this visibility measure with action metrics. If paid impressions increase while engagement and CTR stay weak, additional delivery may give a weak message more exposure without improving its response. If organic impressions rise with shares and comments, audience activity may be contributing to distribution. Similar totals can therefore support different decisions.
A reporting layer should keep the distribution source attached to each metric. Captapi's social media dashboard guide is relevant for teams setting up that structure.
Use these checks when reviewing a post or content group:
- Measure repeat visibility: Compare impressions with reach, rather than treating either figure as unique audience size.
- Separate paid and organic delivery: Total impressions conceal how exposure was acquired.
- Compare formats: More displays do not establish stronger action. Compare similar formats and pair visibility with clicks, comments, or shares.
- Use impression-based rates carefully: Label whether the denominator is total impressions or a filtered impression type.
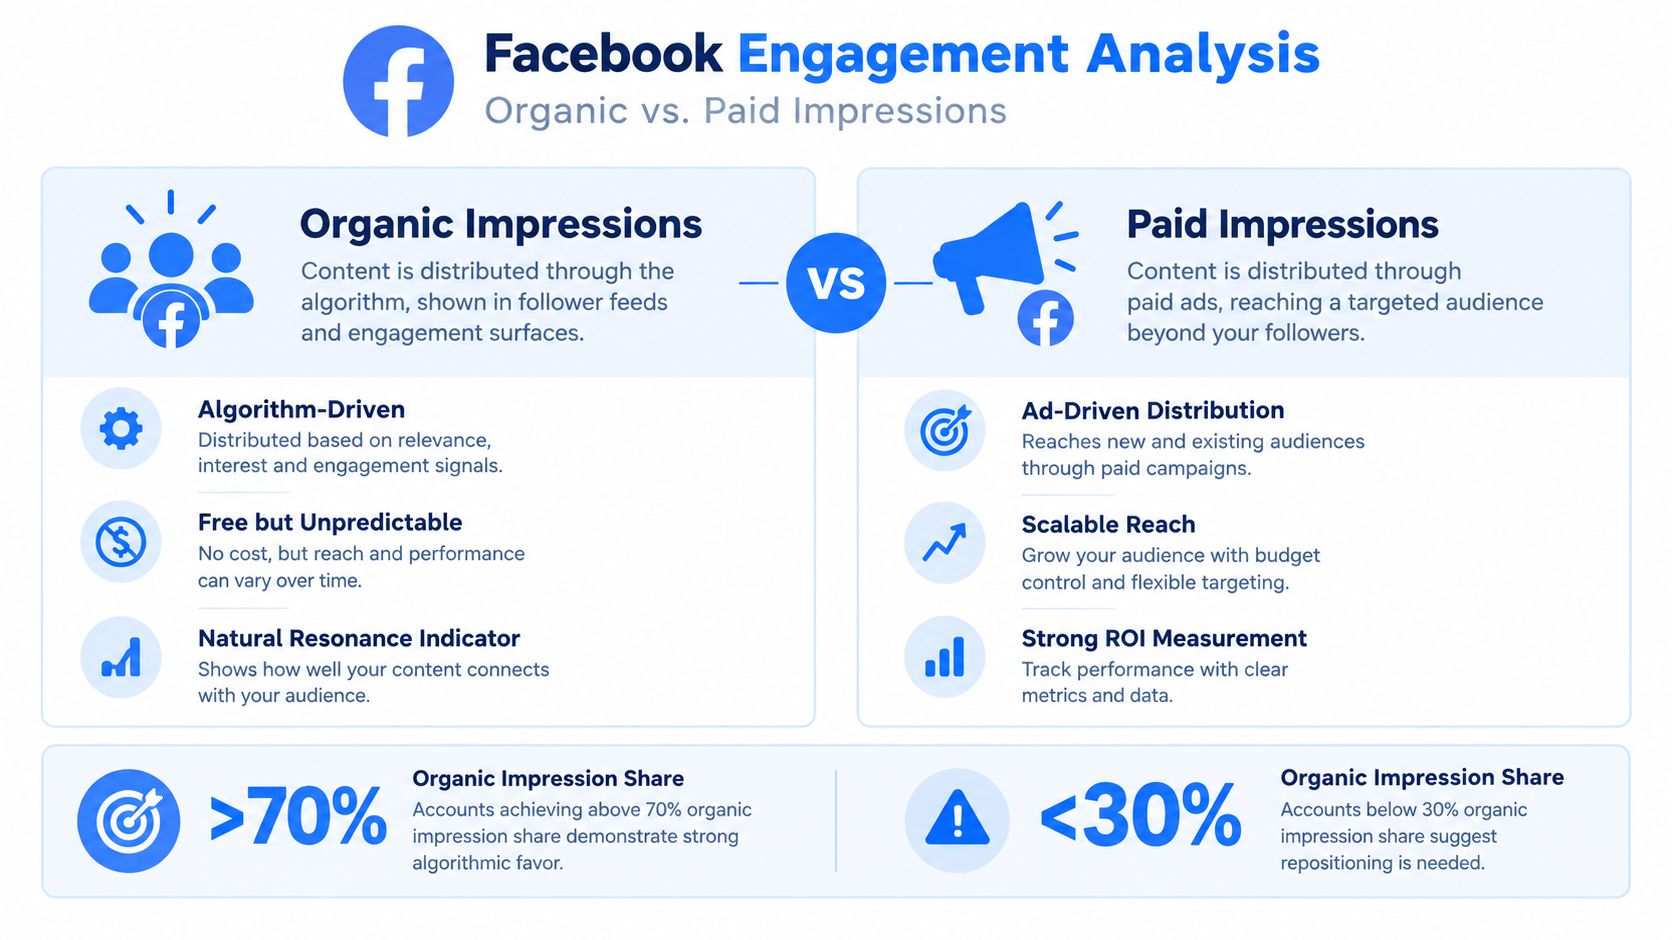
Impressions become analytically useful when they explain another metric. They can show why a post had more opportunities to earn clicks, why frequency changed, or why a follower-based rate does not represent actual exposure. Combine them with reach, interaction, and action measures before judging content performance.
8. Reaction Breakdown
Reaction totals answer how much response a post received. Their composition helps identify the type of response, although no category proves sentiment on its own. Facebook reaction categories include Like, Love, Haha, Wow, Sad, and Angry. Meaning depends on the post, surrounding discussion, and user intent.
Start with the decision the metric should support: emotional response. Calculate each category as a share of total reactions for the same post or content group. Use raw counts to measure volume, then use proportions to compare posts with different exposure. A post with many Likes may have broad acknowledgement, while a smaller post with a higher share of Loves may indicate stronger enthusiasm among those who saw it.
Context changes interpretation. A Like on an announcement may signal recognition rather than approval. Haha can support a joke, mock a claim, or respond to another user's comment. Angry may reflect disagreement with a policy, concern about an incident, or frustration unrelated to the brand.
A practical review pairs reaction shares with conversation and audience segments:
- Emotional response: Track shifts in reaction composition across comparable posts. A customer-service team could flag a new policy announcement when Sad or Angry shares rise.
- Conversation: Read comment text before assigning a cause. Detailed criticism supports a different response from isolated negative reactions.
- Audience: Separate employees, customers, advocates, and critics where data allows. The same post can produce different reaction mixes across these groups.
- Action: Compare reaction composition with clicks, enquiries, or other downstream actions. Approval does not necessarily indicate intent.
The alert should prompt examination, not an automatic crisis conclusion. Analysts should review the comments, check whether a news event changed the context, and determine whether the response concerns the policy, the wording, or a broader issue.
Interpretation improves when emotional response, conversation, and action are read together. Many Likes and Loves with no meaningful discussion may show acknowledgement without intent. Mixed reactions paired with detailed comments may warrant reputation-management attention, even when the overall engagement rate is ordinary. Reactions describe response shape, not the complete reason or business consequence.
Facebook Engagement Metrics: 8-Point Comparison
| Metric | 🔄 Implementation Complexity | ⚡ Resource Requirements | 📊 Expected Outcomes | 💡 Ideal Use Cases | ⭐ Key Advantages |
|---|---|---|---|---|---|
| Engagement Rate | Low, simple (engagements ÷ followers) but needs consistent follower data | Low, engagement counts + follower totals from APIs | Normalized measure of content resonance and comparative performance | Competitive benchmarking, content optimization, RAG trend analysis | Fair cross-account comparison; direct signal of audience interest |
| Reach | Medium, requires unique-user counting and deduplication via API | Medium, reach endpoints and storage for unique viewers | Breadth of visibility; reveals discoverability and algorithmic favor | Campaign analysis, competitor distribution tracking, discoverability audits | Accurate measure of who sees content; separates organic vs paid exposure |
| Click-Through Rate (CTR) | Medium, needs reliable impressions + click capture and attribution | Medium–High, tracking pixels/UTMs and click logs for accuracy | Predictive traffic/conversion signal; effectiveness of CTAs and messaging | CTA optimization, ad copy testing, conversion-focused campaigns | Direct tie to conversion intent; easy to A/B test and optimize |
| Comment Count & Sentiment | High, requires bulk extraction + NLP/sentiment models and moderation | High, comment exports, language models (e.g., GPT-4o-mini), storage | Qualitative audience feedback; topic extraction and crisis detection | Brand monitoring, PR/crisis response, OSINT and community insight | Deep qualitative insights; flags issues and customer concerns early |
| Share Count | Low, straightforward count but downstream attribution is complex | Low, share metrics accessible via APIs; less data volume | Organic amplification indicator; potential viral signal | Viral detection, trend spotting, content virality analysis | Strong endorsement signal; extends reach exponentially |
| Video Views & Avg Watch Time | Medium, requires per-video timing, thresholds, and drop-off analysis | Medium–High, video telemetry, transcripts, processing for retention analysis | Engagement depth and retention; identifies narrative strengths/weaknesses | Video optimization, narrative testing, transcript-based RAG systems | Measures attention quality; key ranking factor for video platforms |
| Impressions & Impressions by Type | Medium, needs breakdown (organic/paid/viral) and reconciliation | Medium, impression logs, ad platform data, time-series storage | Visibility breadth and saturation; baseline for rate calculations | Budget allocation, algorithm behavior analysis, baseline benchmarking | Fundamental distribution metric; essential for ROI and rate computations |
| Reaction Breakdown (Likes, Loves, Hahas, Wows, Sads, Angries) | Low, counts per reaction easy to collect; interpretation requires context | Low, reaction tallies via APIs; minimal processing to aggregate | Emotional response profile; early warning for perception shifts | Sentiment-level monitoring, campaign emotional testing, brand safety | Nuanced emotional insight beyond binary likes; quick signal for sentiment shifts |
Turn Eight Metrics Into One Measurement System
A useful Facebook measurement system begins with a business question, not a dashboard export. Ask whether the decision concerns awareness, distribution, emotional response, conversation, amplification, traffic, or video retention. Each question needs a different primary metric and a different supporting metric.
For visibility, start with reach and impressions. Keep unique exposure separate from repeat display frequency. A page may reach more people, show content more often, or do both. Treating impressions as people will overstate audience size, while treating reach as total delivery will hide repeat exposure.
For interaction, define the numerator and denominator before calculating a rate. Engagements divided by followers, reach, and impressions produce different interpretations. The reported benchmarks illustrate why consistency matters: one source reports a 0.15% average rate, another reports a 3.6% median, and content-type benchmarks range from 0.05% for Link posts to 0.20% for Status posts in the cited datasets. These figures should guide questions, not serve as universal pass or fail thresholds. The methodological differences are discussed in this overview of social media engagement statistics.
Build a compact decision dashboard
A practical dashboard can pair:
- Reach and impressions to separate unique exposure from repeat visibility.
- Engagement rate with its stated denominator to assess interaction relative to exposure or audience size.
- Shares and comments to measure amplification and conversation.
- CTR to evaluate movement toward a destination.
- Video views and average watch time to separate starts from retention.
- Reaction breakdown to identify the emotional composition of response.
Segment every view by format, topic, date range, and distribution source. A Link post shouldn't be judged against a Reel just because both appeared in the same monthly report. The 2025 benchmark data shows why format segmentation matters, with Status posts and Reels reporting different rates from Link posts. That difference doesn't prove one format is universally better. It shows that content type changes the comparison.
Inspect comments and reactions before declaring success. A high engagement rate can reflect disagreement. A high CTR can reflect curiosity without useful downstream behavior. A high reach figure can come from paid delivery. A strong view count can coexist with weak retention.
Captapi can help automate public-data collection for eligible Facebook posts and Reels, including visible engagement fields, comments, and transcript-related analysis where available. Teams using it should define access rules, retention policies, consent requirements, and permitted use before connecting the data to competitive intelligence, social listening, or research pipelines. The tool can support collection and normalization, but customers remain responsible for their data-handling decisions.
The best reporting habit is simple: make every metric answer a specific question, attach its method, and show the evidence that explains the result. For more on interpreting metrics beyond basic ad performance definitions, focus on relationships between measures rather than isolated rankings. Reach paired with engagement explains response among exposed users. Shares paired with comments explain amplification quality. Watch time paired with retention points to content structure. CTR paired with destination behavior connects Facebook activity to business action.
Captapi provides a developer-focused API for collecting public social data across Facebook and other major platforms, including post details, engagement fields, comments, and transcript workflows. Use it to build repeatable competitor monitoring and content-analysis pipelines, then visit Captapi to explore the available endpoints and start testing your Facebook metrics workflow.