
10 Content Engagement Metrics That Matter

Views and likes don't tell you whether content worked. They tell you that content was displayed or that someone made a lightweight interaction. Neither answer is enough if the fundamental question is whether people discovered the content, watched it, discussed it, trusted it, returned to it, or took a commercial action.
The practical way to use content engagement metrics is to match each metric to a funnel question. Reach and impressions describe distribution. Watch time and retention describe attention. Engagement rate, shares, saves, and comments reveal resonance and intent. Follower growth and audience composition show whether attention is becoming a relevant audience. CTR and conversion rate connect content with business outcomes.
This distinction also prevents misleading comparisons. Engagement commonly includes likes, comments, shares, saves, reactions, and clicks, while engagement rate may use followers, reach, impressions, or views as its denominator, depending on the platform and reporting goal, as Hootsuite's engagement-rate guidance explains. Choose one primary KPI for the decision at hand, add a small diagnostic set, and keep definitions stable.
Native analytics remains the source for platform-specific behavior. External tracking, UTMs, transcript analysis, comment extraction, and APIs such as Captapi can add a comparable data layer across YouTube, TikTok, Instagram, and Facebook. Even your reporting language matters. For example, email subject line capitalization may seem unrelated to social analytics, but consistent naming conventions make campaign and content data easier to join.
Table of Contents
- 1. Reach and Impressions
- 2. View Count, Watch Time and Audience Retention
- 3. Engagement Rate
- 4. Share Count and Social Shares
- 5. Saveability and Save Rate
- 6. Comment Volume and Sentiment
- 7. Subscriber and Follower Growth Rate
- 8. Audience Demographics and Growth Quality
- 9. Click-Through Rate
- 10. Conversion Rate
- 10-Point Content Engagement Metrics Comparison
- Build a Metric Stack, Not a Scoreboard
1. Reach and Impressions
Reach and impressions answer the first funnel question: did the content get distributed? Reach counts unique users who saw a post or video, while impressions count total displays, including repeat exposure. The distinction matters because a campaign can generate broad discovery or repeated exposure to a smaller audience, and those outcomes require different decisions.
A high impression count with weak interaction doesn't automatically mean the content failed. It may indicate that a title, thumbnail, opening frame, or recommendation system created visibility without creating enough relevance to earn a click or response. Conversely, low reach with strong interaction can indicate that the content resonates with existing viewers but isn't reaching new audiences.
Read the gap between exposure metrics
Use impressions divided by reach to estimate repeated exposure. A rising ratio can support recall, but it can also signal that distribution is circulating within a narrow audience. Track the ratio alongside clicks, views, and engagement rather than treating it as a quality score.
For YouTube, a decline in reach after a recommendation or search change points toward a distribution problem, not necessarily a content-quality problem. On TikTok, a video may receive extensive exposure while attracting little interaction, which calls for testing the hook, topic framing, or audience fit. On Instagram and Facebook, compare reach from followers, recommendations, shares, and other available sources to identify where distribution is coming from.
Practical rule: Use reach to judge audience expansion and impressions to judge exposure intensity. Don't use either metric alone to declare content successful.
Turn visibility into an API workflow
Capture post-level reach and impressions with publication date, format, platform, topic, and traffic source where available. A normalized data layer can help teams compare distribution patterns without pretending that platform definitions are identical. Captapi's social media measurement guide is relevant for designing that cross-platform workflow.
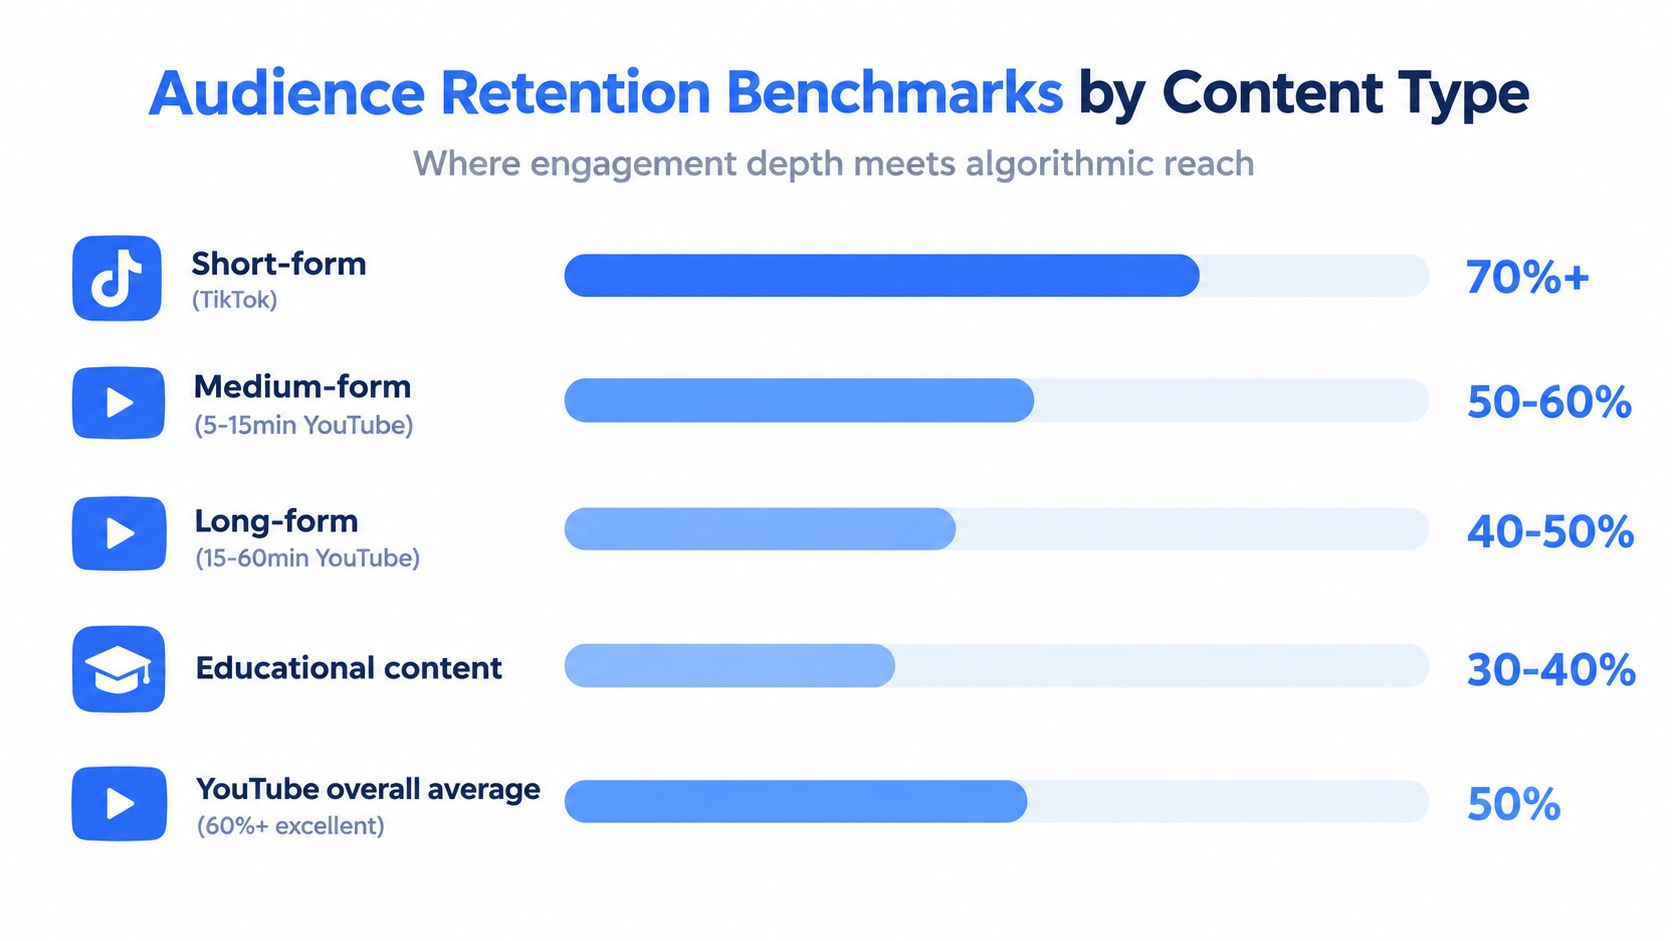
Set reach targets according to the purpose of the content. Awareness content should prioritize qualified distribution, while an existing-community post may be better judged by retention, shares, or conversion activity. Test thumbnails and titles, then connect changes to impression-to-view behavior rather than relying on impressions as the final KPI.
2. View Count, Watch Time and Audience Retention
Views measure consumption events, but they don't show how much of the content people experienced. Watch time adds duration, while audience retention shows where viewers continue, pause, or leave. Together, these metrics distinguish being seen from holding attention.
A longer video can accumulate more total watch time because it offers more minutes, while a shorter video may retain a larger share of each viewer's attention. That's why retention percentage and minute-by-minute drop-off should be reviewed alongside total watch time. YouTube and TikTok use viewing behavior within recommendation systems, but each platform defines views and retention through its own analytics rules.

Find the moments that change behavior
A retention curve is more useful than an average when it helps an editor locate a decision point. An early drop may expose a weak opening, a delayed answer, or a mismatch between the title and the delivery. A later decline may show that the explanation became repetitive or that the promised payoff arrived too late.
For educational content, compare retention across lessons or segments and use transcripts to identify the language around strong and weak moments. For TikTok and Instagram video, examine completion and rewatch behavior where the native analytics make those signals available. For Facebook video, separate autoplay exposure from meaningful viewing as far as the platform reporting allows.
Watch time tells you how much attention accumulated. Retention tells you where the content earned or lost it.
Build a dataset with video length, views, watch time, average view duration, retention points, comments, shares, and saves. Captapi's video engagement metrics resource can support the planning of a workflow that combines platform data with transcript analysis. Use the resulting patterns to test openings, pacing, sequencing, and content length. Don't set a universal retention threshold across formats. A tutorial, interview, short explainer, and livestream invite different viewing behavior.
3. Engagement Rate
Engagement rate normalizes interaction against an exposure or audience denominator. A common view-based formula is:
Engagement rate = total interactions ÷ views × 100
Interactions might include likes, comments, shares, saves, reactions, and clicks, but the exact numerator varies by platform. A reach-based rate answers a different question from a follower-based rate, and an impressions-based rate is not interchangeable with either. The formula is only useful when the team records which actions and denominator it used.
The engagement-rate calculator can help standardize the arithmetic, but calculation isn't the difficult part. The difficult part is deciding whether the metric should represent response from people who saw the content, response from the existing audience, or interaction per display.
Segment before you benchmark
Platform differences make a universal threshold misleading. Buffer's 2026 benchmark data reports median engagement rates of 6.2% on LinkedIn, 5.6% on Facebook, 5.5% on Instagram, 4.6% on TikTok, 4.0% on Pinterest, 3.6% on Threads, and 2.5% on X in its benchmark summary. These figures aren't interchangeable targets for YouTube, TikTok, Instagram, or Facebook content because platform populations, formats, and denominators differ.
Compare posts within the same platform, format, audience segment, and reporting window. A carousel, short video, livestream, and static image may generate different interaction patterns even when they address the same topic. Captapi can normalize fields such as views, likes, comments, shares, saves, interactions, and engagement rate for public posts, while your reporting layer should preserve the original platform values and formula.
A rate is a comparison tool, not a verdict. It becomes useful only after you define what counts as an interaction and what the denominator represents.
Use engagement rate as the primary KPI when the decision concerns resonance. Use shares, saves, comments, or clicks as diagnostics when you need to understand the quality of that response.
4. Share Count and Social Shares
A share is a distribution action performed by an audience member. Unlike a like, it can move content into a new network, private conversation, group, community, or messaging thread. That makes shares especially useful for studying active endorsement and secondary distribution, although platform reporting may not expose every destination or distinguish every sharing behavior.
A high share count can mean different things. People may share a useful tutorial, an emotionally charged opinion, a joke, a warning, or a controversial claim. The metric shows that content traveled, not why it traveled or whether the new audience was relevant. Pair shares with comments, sentiment, landing-page visits, and downstream conversions before describing a post as commercially valuable.
Measure the distribution pattern
Track shares per view or shares per reach, then compare that rate by format and topic. Record the time to the first share, the timing of later bursts, and any available source information. A rapid burst may indicate that a creator, community, or external mention introduced the content to a new audience. A steady share pattern may point to evergreen usefulness.
Build shareable units into longer content. A clear chart, concise takeaway, surprising demonstration, or practical excerpt can give viewers a reason to pass the content onward. Calls to share should fit the audience's motivation, rather than interrupting the content with a generic request.
TikTok variations, professional discussion on LinkedIn, and educational videos circulated through social networks or forums all illustrate different forms of sharing. For creative teams, guidance on AI visuals for TikTok strategies can inform asset development, but the measurement question remains the same: did the visual encourage distribution to people who were likely to care?
Use shares as a priority metric when the goal is audience expansion or peer recommendation. Don't rank every post by share count. A niche post with fewer shares may reach a more relevant audience than a broadly shared post that produces no meaningful action.
5. Saveability and Save Rate
Saves and bookmarks reveal a different form of interest from likes or comments. A save usually indicates that someone expects to return to the content, use it as a reference, or keep it available for a future decision. That makes saveability particularly relevant for tutorials, checklists, recipes, product comparisons, educational explainers, and reference-led posts.
A simple save rate is:
Save rate = saves ÷ views × 100
The denominator must be recorded. A save rate based on reach answers a different question from one based on views, and Instagram, TikTok, Facebook, and YouTube may expose different save or playlist behaviors. Preserve the native metric and formula rather than forcing every platform into one field without context.
Pair saves with evidence of use
A save alone doesn't prove that the person later used the information. Combine saves with repeat views, profile visits, comments asking follow-up questions, link clicks, or conversions where those events can be connected. High saves and weak retention may mean that the packaging is useful but the delivery isn't. High saves and strong retention suggest content that offers both immediate attention and future reference value.
Create content that supports retrieval. Use descriptive on-screen labels, clear chapters, concise summaries, and structured captions. A creator can also invite viewers to save a tutorial for later, but the prompt works best when the content contains a concrete reason to return.
Measurement decision: Treat saves as a signal of anticipated future value, then test whether that anticipated value leads to repeat consumption or action.
For an API workflow, store saves with the post URL, platform, format, topic, publication date, and retention fields. Flag high-save content for editorial review, but don't automatically treat it as superior training data for a RAG system. Human review still matters because a frequently saved post can contain ambiguity, outdated advice, or incomplete context.
6. Comment Volume and Sentiment
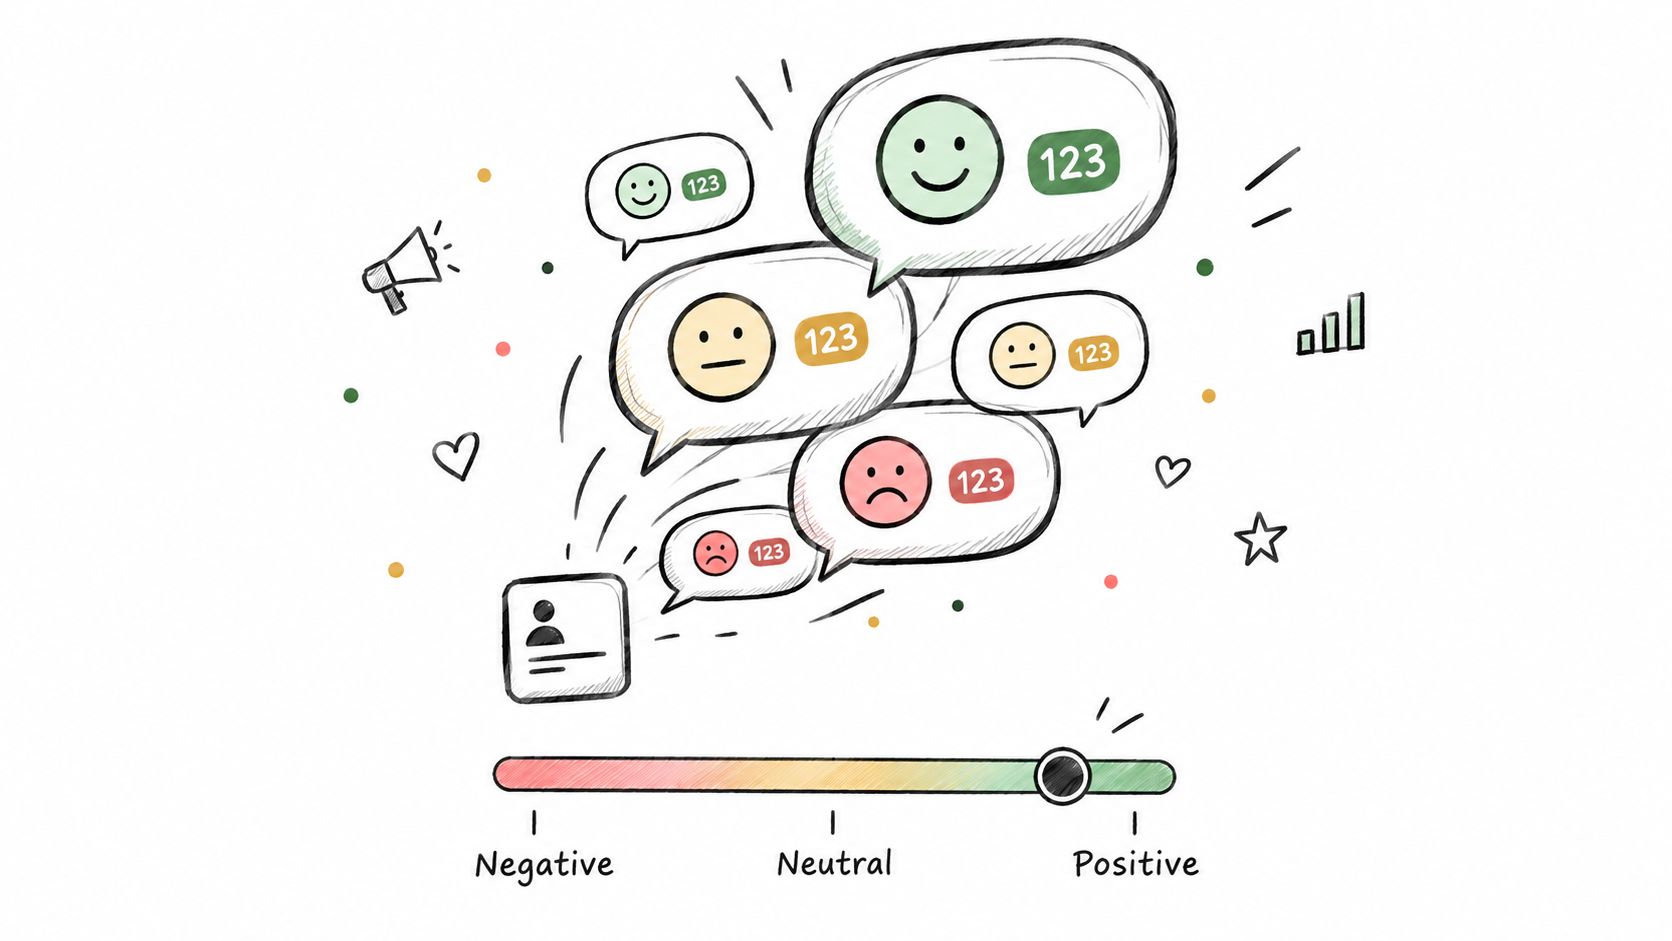
Comments combine quantity with conversation quality. Volume indicates that viewers were willing to respond publicly, while sentiment and topic analysis help explain whether they expressed approval, confusion, disagreement, curiosity, or frustration. A large comment count can represent strong community participation, but it can also reflect controversy or an unresolved problem.
Start by separating top-level comments from replies. A post with many replies may have created a genuine discussion, while a post with many isolated reactions may have generated less conversational depth. Track questions, objections, requests, praise, and recurring language. Those categories often provide more useful editorial direction than a single positive or negative label.
Turn comments into audience intelligence
On YouTube, TikTok, Instagram, and Facebook, extract comments with timestamps and post identifiers where the platform and access method permit. Captapi's social sentiment analysis guide is relevant to workflows that combine comment collection with classification and summarization.
Use sentiment analysis as a triage layer, not as a final interpretation. Sarcasm, cultural context, slang, and thread context can change the meaning of a short comment. Have a reviewer inspect representative examples, especially when a campaign or product launch generates negative discussion.
Responding to early comments can help the team learn what viewers misunderstood and what they want next. Pin useful answers, address repeated objections in follow-up content, and record whether comment themes change after those responses. This makes comments both a measurement source and an input to content planning.
A comment is more valuable as evidence when you know what the person is trying to say, not just that the person typed something.
For RAG or language-analysis workflows, preserve the original text, language, reply structure, and collection time. Don't strip context before analysis. The same phrase can express praise in one thread and criticism in another.
7. Subscriber and Follower Growth Rate
Follower or subscriber growth shows whether content is converting attention into an ongoing relationship. Absolute growth can favor large accounts, so growth rate is usually more useful for trend analysis:
Growth rate = (new followers or subscribers minus lost followers or subscribers) ÷ previous audience × 100
Use a consistent reporting window and record both gains and losses. A single spike may follow a viral post, creator collaboration, news event, or paid promotion. It doesn't necessarily indicate that the underlying content strategy has improved.
Diagnose the conversion from viewer to follower
Compare growth with the content published during the same period. If reach rises but follower growth stays flat, discovery may be working while the profile promise, channel positioning, or follow prompt fails to convert. If follower growth rises while watch time and comments weaken, the account may be accumulating a less relevant audience.
Track growth by platform and content type. A YouTube explainer may attract subscribers through search, while a TikTok clip may generate broad discovery without producing the same level of channel commitment. Instagram and Facebook growth can also reflect recommendations, shares, collaborations, or paid activity, so document the source whenever native analytics make it available.
A useful dashboard shows the direction of change rather than celebrating one period. Include publication volume, reach, retention, engagement rate, shares, saves, and follower conversion. This helps distinguish a genuine improvement from a change caused by publishing more often.
Growth is a health metric only when the new audience remains relevant and engaged.
Use an API to collect public channel or page details and combine them with your own first-party analytics. For competitor monitoring, compare trends and content themes rather than claiming that another account's growth proves a specific tactic caused it. Growth data can identify a strategic shift, but it rarely explains causality by itself.
8. Audience Demographics and Growth Quality
Audience size becomes useful only when you know who the audience is. Demographic reporting may include age, gender, location, language, interests, and other platform-defined categories. Growth quality asks whether new followers or subscribers match the audience you need, whether they engage with the content, and whether they can plausibly become customers, members, or valuable partners.
A sudden change in geography can affect language, publishing times, examples, offers, and sponsorship positioning. A change in age distribution can affect tone, format, pricing context, and platform priorities. These are not reasons to reject new audiences. They're reasons to revise the content and reporting model.
Measure relevance, not just composition
Review audience composition at a regular interval and compare it with target markets. Then connect demographic segments to reach, retention, engagement, shares, saves, clicks, and conversion events where privacy-safe aggregation permits. A large segment with weak downstream behavior may be less valuable than a smaller segment that repeatedly watches, saves, and clicks.
Separate organic, paid, referral, and collaboration-driven growth when possible. Paid acquisition can expand reach, but the resulting audience should be evaluated by subsequent behavior rather than by follower volume alone. For creators and brands, this distinction also changes how partnerships are presented to sponsors.
Cross-platform comparisons require care. A demographic category on YouTube may not map neatly to an Instagram or Facebook category, and public competitor data may not include the same fields as first-party account data. Captapi can help collect available public channel and page information, but it can't replace the native analytics available to the account owner.
Use content tests to learn what different segments respond to. Change one meaningful variable at a time, such as language, topic framing, or example selection, and observe not only who arrives but who stays and acts. That produces a more reliable definition of audience quality than demographic growth alone.
9. Click-Through Rate
Click-through rate measures movement from content exposure to a link, card, profile destination, product page, or other tracked action:
CTR = clicks ÷ impressions × 100
Some platforms or reports may use views or reach instead of impressions. That choice changes the interpretation, so label the denominator in every dashboard. A click can also vary in quality. A curious visitor who leaves immediately isn't equivalent to a visitor who reads, signs up, starts a trial, or completes a purchase.
Connect the click to its source
Use UTMs on links in descriptions, bios, landing pages, pinned comments, and campaign assets. Keep source, medium, campaign, content, and format naming consistent. Then join platform clicks with web analytics, CRM records, and conversion events.
Test the path from attention to action. A video may earn strong retention but weak CTR because the offer is unclear, the call to action arrives too late, or the destination doesn't match the promise. A post may generate modest interaction but strong clicks because it reaches a high-intent audience.
For YouTube, compare cards, descriptions, pinned comments, and channel links where reporting supports those distinctions. On TikTok, Instagram, and Facebook, separate profile clicks, outbound clicks, and tracked landing-page sessions rather than putting them into one undifferentiated total. Captapi can extract public descriptions and other content fields for competitive analysis, but your own UTM and web data should remain the authority for owned traffic.
Use CTR as the primary KPI when content's immediate job is traffic generation. Use engagement rate and retention as diagnostics, then check landing-page behavior before concluding that a creative change improved performance. A higher CTR with poor post-click quality may indicate a stronger promise, but not a better customer journey.
10. Conversion Rate
Conversion rate connects content with a defined business action. The action might be a signup, download, lead submission, purchase, booking, or subscription. A basic viewer-based formula is:
Conversion rate = conversions ÷ viewers × 100
For a website or campaign report, teams may instead use clicks or sessions as the denominator. Neither is universally correct. The denominator should match the decision, and the report should state whether it measures content-to-conversion, click-to-conversion, or landing-page conversion.
Define the action before optimizing
A conversion needs a clear event and attribution rule. Use UTMs, first-party analytics, CRM records, and a documented attribution model. First-click, last-click, and multi-touch models answer different questions about how content contributed to the final outcome.
Segment results by platform, format, topic, audience, traffic source, and content stage. A YouTube tutorial may generate fewer direct purchases but assist later conversions, while a Facebook retargeting post may capture existing demand. A TikTok discovery video and an Instagram product demonstration shouldn't share one blanket target if they serve different roles.
Use transcripts and comments to identify language patterns around high-converting content, but don't assume that copying wording will reproduce the result. The offer, audience, timing, distribution, trust, and landing-page experience all influence conversion. Captapi's content performance metrics guide can help frame the broader measurement workflow.
The strongest conversion report explains both what happened and what the content was supposed to make possible.
Review high-converting examples with editorial, growth, and sales teams. Look for recurring objections answered, benefits clarified, proof supplied, and next steps made visible. Then test one change at a time across the creative and destination. A conversion rate is an outcome metric, but it becomes actionable only when the team can connect the result to a controllable part of the journey.
10-Point Content Engagement Metrics Comparison
| Metric | Implementation Complexity 🔄 | Resource Requirements ⚡ | Expected Outcomes 📊 | Ideal Use Cases 💡 | Key Advantages ⭐ |
|---|---|---|---|---|---|
| Reach and Impressions | Low, built-in analytics or API pulls | Low–Medium, platform access; cross-platform normalization | Measures distribution and frequency; baseline for engagement rates | Diagnose discoverability vs content quality; monitor algorithm shifts | Normalizes visibility; early detector of distribution changes |
| View Count / Watch Time & Audience Retention | Medium, requires time-series retention analysis | Medium, playback data, transcripts, retention curves | Depth-of-engagement signals that drive recommendations 📊 | Optimize video structure, hooks; prioritize content for recommendation algorithms | Strong algorithmic signal for visibility and monetization |
| Engagement Rate | Low–Medium, simple formula but consistent definition required | Low, interaction counts (likes/comments/shares) | Normalized resonance metric across audience sizes | Compare content performance; identify high-resonance posts | Better predictor of virality and genuine interest ⭐ |
| Share Count / Social Shares | Low, available in analytics but may need external tracking | Low–Medium, tracking native and external shares; UTMs for referrals | Amplification and network spread; strong reach multiplier | Creators seeking virality; campaigns aiming for organic distribution | High virality potential; weighted by algorithms for distribution |
| Saveability / Save Rate | Low, platform exposes saves but definitions vary | Low, access to save/bookmark metrics | Indicator of long-term/reference value and re‑engagement | Educational, how‑to, and reference content selection | Signals durable value and content worth resurfacing ⭐ |
| Comment Volume and Sentiment | Medium, requires extraction + NLP sentiment analysis | Medium–High, comment exports, moderation tools, AI models | Qualitative audience feedback and sentiment trends | Community engagement strategies; product feedback mining | Direct user insights; fuels content ideation and moderation |
| Subscriber / Follower Growth Rate | Medium, needs historical trend analysis | Medium, follower history and churn tracking | Momentum and channel health; predictive trajectory | Channel health monitoring; benchmarking and strategy validation | Normalizes for size; early momentum indicator ⭐ |
| Audience Demographics & Growth Quality | Medium–High, requires demographic aggregation and source attribution | Medium–High, platform demographic reports, third‑party enrichment | Audience fit, sponsorship value, and localization signals | Sponsorship decisions; market targeting and localization | Assesses audience quality beyond raw counts; monetization relevance |
| Click-Through Rate (CTR) | Medium, needs proper link/UTM setup and attribution | Medium, link tracking, UTM discipline, card/sticker setup | Measures content-to-action efficiency; immediate traffic signal | Drive website signups, affiliate conversions, A/B CTA testing | Directly ties creative to traffic; actionable for optimization ⚡ |
| Conversion Rate (Content-to-Action) | High, requires end‑to‑end tracking and attribution | High, UTMs, pixels, CRM, landing page instrumentation | Direct business impact and ROI measurement 📊 | Revenue-focused campaigns, lead gen, e‑commerce funnels | Measures real ROI; prioritizes content that converts ⭐ |
Build a Metric Stack, Not a Scoreboard
A useful measurement system doesn't ask every platform to produce one winning number. It assigns each metric a role in the funnel and records the limitations that come with that role.
Use reach and impressions to diagnose distribution. Reach indicates how many unique people encountered the content, while impressions indicate total exposure. If reach is weak, investigate discovery, search visibility, recommendation access, topic demand, and audience targeting. If impressions are strong but clicks or views are weak, inspect titles, thumbnails, opening frames, and the match between the promise and the content.
Use watch time and retention to measure attention. Total watch time shows accumulated consumption, while retention reveals where viewers stay or leave. Compare these metrics within similar formats and lengths. A longer video shouldn't automatically win because it has more available minutes, and a short video shouldn't automatically win because its completion percentage is easier to achieve.
Use engagement rate, shares, saves, and comments to assess resonance. Engagement rate provides a normalized view of interaction, but only after you define the numerator and denominator. Shares indicate distribution through audience networks. Saves indicate anticipated future value. Comments reveal conversation and language, but sentiment and context determine whether volume represents approval, confusion, or conflict.
Use follower growth and audience quality to evaluate relationship health. Growth rate shows momentum relative to the existing audience, while demographic and source data show whether that momentum is relevant. A larger audience isn't automatically a better audience. Review subsequent viewing, saving, clicking, and conversion behavior before treating growth as strategic progress.
Use CTR and conversion rate to connect content with outcomes. CTR measures the move to the next destination. Conversion rate measures completion of the defined action. Connect both with UTMs, web analytics, CRM events, and a documented attribution model. If you can't identify the event, denominator, source, and reporting window, the metric isn't ready for executive decision-making.
Choose one primary KPI
Select the primary KPI according to the content's job:
- Discovery content: Use qualified reach or impressions, with engagement and retention as diagnostics.
- Video education: Use retention or watch time, with saves, comments, and clicks as diagnostics.
- Community content: Use engagement rate or comment quality, with shares and follower conversion as diagnostics.
- Lead-generation content: Use CTR or conversion rate, with retention and landing-page behavior as diagnostics.
- Commercial content: Use conversion rate or qualified leads, with CTR and assisted-conversion data as diagnostics.
Keep the diagnostic set small. A dashboard that exposes every available field can still hide the decision because teams spend their time explaining fluctuations instead of changing content. Review the same reporting window across YouTube, TikTok, Instagram, and Facebook, but don't erase platform-specific definitions to make the chart look uniform.
Preserve native meaning in unified data
Native analytics should remain the authority for platform-specific reach, retention, audience, and conversion fields. A unified REST API can add operational consistency by collecting public post data, comments, transcripts, descriptions, and normalized interaction fields. Captapi is one option for teams that need a developer-first interface across supported social platforms, including workflows for competitor analysis, social listening, RAG inputs, and content operations.
The integration should store both normalized and source fields. Keep the platform, endpoint, collection time, content type, denominator, and formula version beside each metric. That prevents a normalized engagement rate from being mistaken for a universal platform truth.
The same principle applies to emerging formats and creator-led content. Recent coverage identifies shares as an increasingly important KPI and reports that creator partnerships can outperform brand content across several engagement dimensions, but those observations should guide hypotheses rather than replace your own segmented measurement. A report about virtual character metrics can also broaden the measurement conversation, but the framework remains the same: define the audience, action, and business purpose before choosing the score.
Build a reporting layer that lets analysts move from exposure to action. Start with the post or video ID, attach native metrics, add transcript and comment data, join UTMs and web events, and connect qualified outcomes in the CRM. Then review patterns by platform, format, topic, audience segment, and publication period. The goal isn't to make YouTube, TikTok, Instagram, and Facebook look identical. The goal is to make their differences explicit enough that your team can make better content decisions.
Captapi can provide a unified REST interface for public YouTube, TikTok, Instagram, and Facebook data, including engagement fields, comments, transcripts, summaries, and channel or page details. Use it to build repeatable content engagement metrics workflows, enrich RAG or competitive-analysis pipelines, and preserve platform-level context in your reports. Visit Captapi to explore the API and connect your measurement workflow.