
10 Competitor Analysis Methods for Smarter Strategy
Stop Guessing What Competitors Are Doing
Competitor research isn't a feature-listing exercise. A list can tell you that one API supports transcripts while another supports comments, but it won't explain which capability influences a buying decision, how reliable the implementation is, or whether customers are switching because of price, support, or integration friction. Strong competitor analysis combines strategic frameworks, product benchmarks, customer evidence, commercial context, and public market signals.
The 10 competitor analysis methods below work as complementary lenses. SWOT and Porter's Five Forces clarify strategic pressure. Benchmarking, feature grids, and architecture reviews expose observable differences. Social listening, interviews, and win/loss analysis test whether those differences matter to real buyers. Pricing and positioning analysis then turn the evidence into decisions.
Start by defining the complete competitor set. Include direct rivals, indirect solutions, substitutes, and AI-native alternatives, then map the buyer's research journey rather than relying only on search overlap. AI citation share also deserves attention. A brand may rank below a rival in organic results yet appear more often in ChatGPT, Perplexity, or Google AI Overviews because its content offers clearer facts, stronger citation structure, or better schema. This broader approach complements data-driven SEO competitor research.
When public conversations matter, Captapi can collect social posts, comments, transcripts, engagement metrics, and search results across supported platforms. Used responsibly, that data gives analysts a way to validate assumptions instead of treating competitor messaging as market truth.
Table of Contents
- 1. SWOT Analysis
- 2. Porter's Five Forces Analysis
- 3. Benchmarking
- 4. Feature Matrix and Competitive Grid Analysis
- 5. Social Listening and Brand Monitoring
- 6. Win and Loss Analysis
- 7. Customer Interview and Feedback Analysis
- 8. Pricing Strategy and Cost Analysis
- 9. Technology and Architecture Stack Analysis
- 10. Market Segmentation and Positioning Analysis
- 10-Method Competitor Analysis Comparison
- Turn Competitive Signals Into Decisions
1. SWOT Analysis
SWOT analysis remains useful because it forces analysts to separate internal capability from external pressure. The framework evaluates strengths, weaknesses, opportunities, and threats, but its value depends on the evidence placed inside each category. A generic statement such as “strong brand” tells a team very little. A specific observation about documentation, endpoint consistency, customer support, or platform coverage can guide an actual decision.
The method has a documented place in the history of competitor analysis. SWOT emerged between 1960 and 1970 from work at the Stanford Research Institute, where a research team examined more than 5,000 executive interviews from 1,100 companies before the approach evolved from the SOFT framework. The historical reconstruction of SWOT explains why the framework became a structured way to assess strengths, weaknesses, opportunities, and threats.
For an API platform, a SWOT review might compare a unified REST interface with rivals that require separate authentication implementations. It might also identify external threats such as platform API changes or opportunities connected to demand for transcript extraction in retrieval-augmented generation systems.
Make the grid decision-ready
Use cross-functional input, but don't let opinion become evidence.
- Strengths: Record capabilities customers can observe or verify, such as consistent API design or broad platform access.
- Weaknesses: Focus on competitor-specific gaps, including incomplete documentation, limited support, or restricted workflows.
- Opportunities: Connect unmet needs to a reachable customer segment or product action.
- Threats: Track changes in suppliers, platform rules, substitutes, buyer expectations, and AI discovery.
Practical rule: Every SWOT entry should lead to a question, a test, or an owner. Otherwise, it's commentary, not intelligence.
2. Porter's Five Forces Analysis
Porter's Five Forces examines industry structure, not individual product features. It asks how competitive rivalry, new entrants, suppliers, buyers, and substitutes shape the ability to create and defend value. That distinction matters because a company can outperform competitors on product quality while operating in a market where suppliers control access, buyers can switch easily, or substitutes keep prices under pressure.
For a social data API, supplier power may be significant because platforms control access rules, terms of service, and native APIs. A change by a major social network can affect every third-party provider, regardless of how well its own software works. Buyer power also rises when enterprise customers can request custom endpoints, service-level agreements, or dedicated support. Substitute pressure comes from native platform APIs, internal engineering teams, no-code tools, and direct data partnerships.
Analyze forces as moving conditions
Don't label each force “high” or “low” and file the document away. Record its current condition, the evidence behind it, and the direction you expect it to move.
- New entrants: Scraping software may be accessible, but reliability, compliance, maintenance, and platform changes create harder operational requirements.
- Supplier power: Identify which upstream platforms can change access, pricing, or technical requirements.
- Buyer power: Examine switching costs, procurement demands, integration dependencies, and the availability of alternatives.
- Substitutes: Include internal builds and native tools, not only companies with similar websites.
- Rivalry: Compare how competitors fight for the same use cases, distribution channels, and customer segments.
This framework reveals why a feature gap may not be the best opportunity. If a capability depends on a supplier that can withdraw access, the strategic answer may involve resilience, caching, compliance processes, or alternative sources rather than a marketing claim.
3. Benchmarking
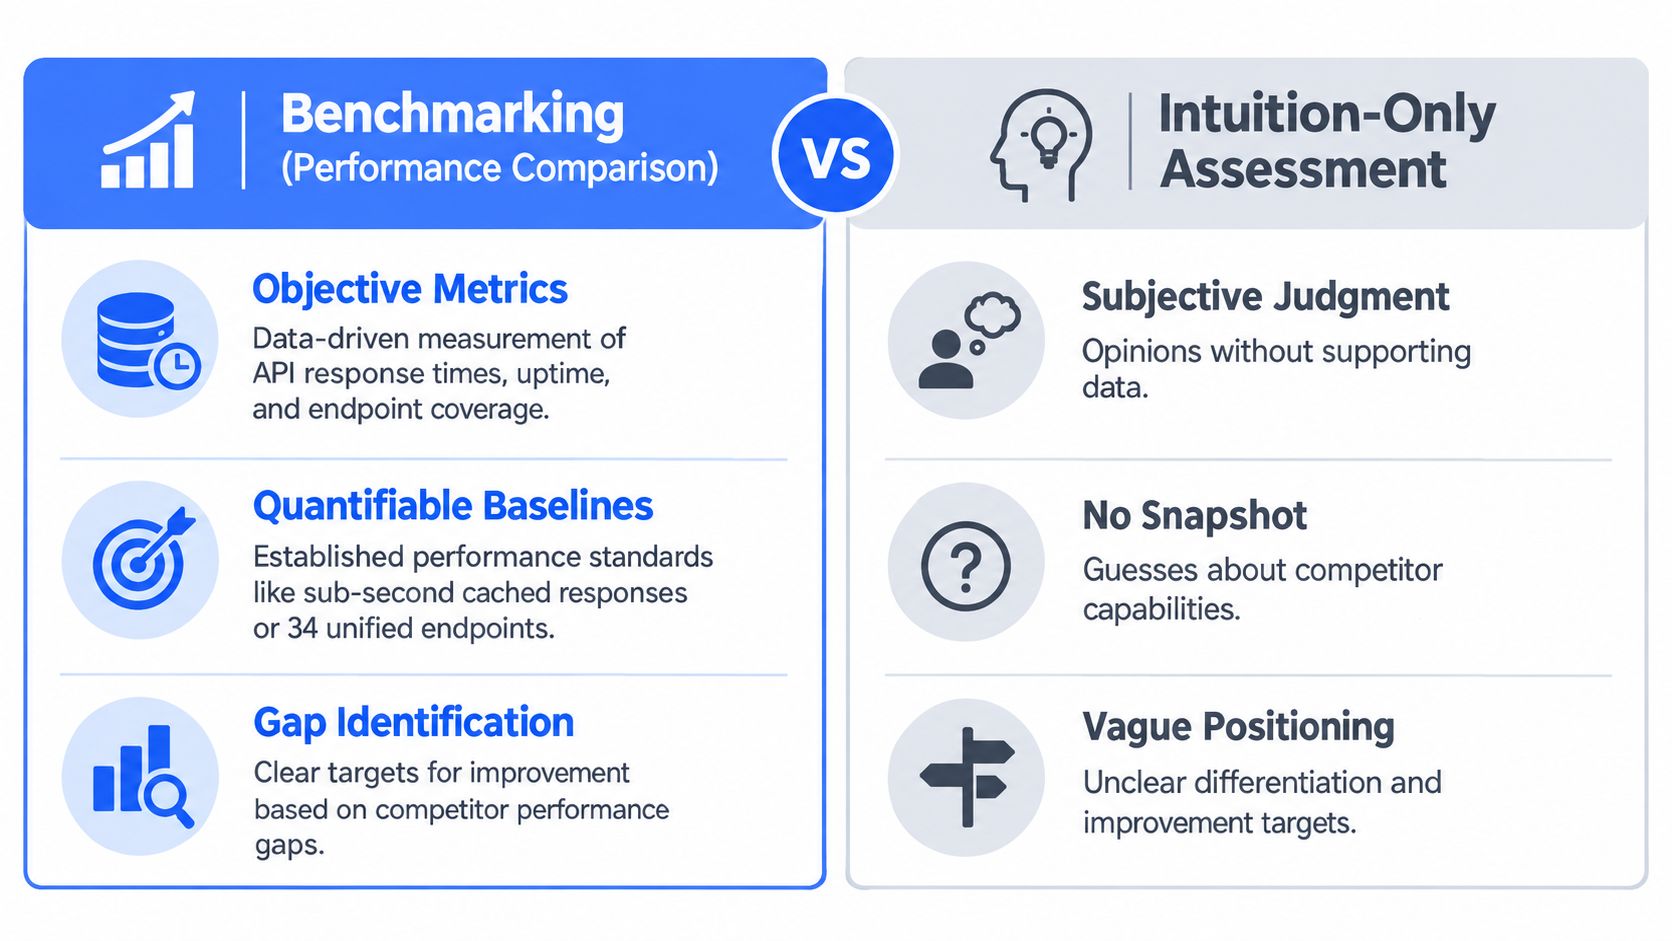
Benchmarking turns broad competitive impressions into repeatable comparisons. Instead of saying that a rival has a better developer experience, define observable tests such as documentation clarity, time to make a first request, error handling, endpoint consistency, support responsiveness, and response behavior under different conditions.
For Captapi and similar platforms, useful dimensions include supported networks, authentication requirements, transcript and comment extraction, engagement data, pricing structure, cache behavior, rate limits, and service commitments. The analyst should separate public claims from tested results. A competitor's documentation may promise reliability, but an API test can reveal inconsistent schemas, unclear errors, or extra implementation steps.
A benchmarking program should also include market-facing signals. Monitor competitor announcements, product changes, and public complaints alongside technical tests. Captapi can help collect public social content and comments that add context to a dashboard, although social engagement isn't a substitute for controlled product testing.
Choose metrics that reflect buyer risk
Benchmarking becomes misleading when teams measure what's easy rather than what matters. A developer may care about authentication and error messages, while an enterprise buyer may prioritize support, governance, and predictable operating cost.
- Technical metrics: Test latency, response completeness, error recovery, pagination, and schema consistency.
- Workflow metrics: Record the steps required to authenticate, find documentation, make a request, and export results.
- Commercial metrics: Compare pricing units, minimum commitments, included usage, and overage treatment.
- Experience metrics: Review support channels, documentation freshness, examples, and onboarding clarity.
Use the competitor analysis chart guide to organize comparisons without collapsing different buyer priorities into one score. Then repeat the same tests across competitors and record the date, environment, endpoint, and assumptions. A benchmark without a method can't support a confident conclusion.
4. Feature Matrix and Competitive Grid Analysis
A feature matrix answers a narrower question than SWOT or Five Forces: what does each competitor offer, and how does the offer differ? Its familiar grid format helps product managers, sales teams, and buyers compare platform support, authentication, endpoint coverage, documentation, support, and commercial packaging.
The risk is treating every row as equally important. A missing feature may matter greatly to one persona and barely at all to another. For example, an AI startup building a retrieval pipeline may value transcript quality and export options, while a marketing agency may care more about comments, engagement metrics, bulk workflows, and cross-platform coverage. A grid that gives both needs the same weight can produce the wrong roadmap.
Build persona-specific grids
Start with customer interviews or sales evidence, then assign importance to each capability. Use qualitative ratings such as essential, useful, or irrelevant when precise weighting would create false confidence.
A social data comparison might examine:
- Platform access: YouTube, TikTok, Instagram, and Facebook coverage.
- Extraction types: Transcripts, comments, summaries, channel details, page details, and search results.
- Authentication: API keys, OAuth requirements, account permissions, and setup complexity.
- Developer experience: REST consistency, examples, SDK availability, and error documentation.
- Commercial fit: Credit-based usage, subscriptions, trials, limits, and support tiers.
Include a notes field for conditions. “Supports transcripts” doesn't reveal language coverage, output format, failure behavior, or whether the endpoint handles the customer's actual content. Public documentation should be checked against practical tests and customer feedback.
For a cross-platform use case, the YouTube channel comparison guide can help frame the types of channel-level information analysts may need. Keep the matrix current, but don't update it mechanically. Every change should connect to a buyer question, a product decision, or a sales objection.
5. Social Listening and Brand Monitoring
Public conversation often exposes the gap between what competitors promise and what users experience. Social listening captures complaints, praise, requests, comparisons, and reactions to launches or outages. It can also reveal the language customers use when describing a problem, which is valuable for product messaging and search content.
For API businesses, useful sources include public posts on X, LinkedIn discussions, GitHub issues, Stack Overflow questions, and comments attached to competitor-adjacent videos. A buyer may not write “the competitor has weak reliability.” They may describe repeated failures, unclear errors, missing data, or a workaround. Those details are more actionable than sentiment labels alone.
Treat conversation as evidence, not a vote
High engagement doesn't automatically prove market importance. A loud complaint may represent a narrow edge case, while a quiet recurring request may point to a broader opportunity. Capture the post, date, product context, stated problem, and whether other users describe the same issue.
Captapi can support brand sentiment tracking by collecting public comments and engagement signals across supported social platforms. Analysts should still review samples manually, especially when sarcasm, technical language, or reposts could distort automated interpretation.
A practical monitoring system can track:
- Reliability language: Mentions of outages, missing results, stale data, or retries.
- Commercial language: Reactions to price changes, limits, trials, and contract terms.
- Capability requests: Repeated demands for platforms, formats, endpoints, or exports.
- Positioning language: The words users associate with speed, simplicity, compliance, or support.
- Emerging prompts: Questions that indicate how buyers research a category in social and AI environments.
Use alerts to find events, then use periodic thematic analysis to find patterns. The first is operational monitoring. The second produces strategy.
6. Win and Loss Analysis
Win/loss analysis studies actual buying decisions, making it one of the strongest methods for testing assumptions from feature grids and pricing pages. A lost deal can reveal that the customer cared about real-time responses rather than cached results. Another prospect may reject an internal build not because the product lacks features, but because procurement requires a dedicated service agreement.
The analysis should include more than the salesperson's explanation. Sales teams may remember the final objection, while technical buyers remember integration risk and economic buyers remember budget or approval friction. Interview the relevant participants where possible, and compare the customer's account with internal notes, proposal versions, product demos, and competitors considered.
Ask about the decision sequence
A useful interview reconstructs the path from problem to decision:
- Trigger: What changed or created urgency?
- Consideration set: Which direct, indirect, substitute, or internal options were evaluated?
- Evaluation criteria: Which requirements were mandatory, preferred, or irrelevant?
- Decision event: What made the selected option safer, easier, or more valuable?
- Unresolved concern: What nearly blocked the purchase or could cause future switching?
Avoid asking only, “Why did we lose?” That wording invites a convenient answer. Ask what the buyer compared, tested, shared internally, and rejected. Then code responses into consistent themes rather than collecting isolated anecdotes.
A performance attribution framework can help connect competitive findings to the broader question of which touchpoints influenced a decision. The output should be a pattern report, not a blame report. If several losses involve support requirements, the response may be a service package. If several wins involve simpler integration, marketing should make that advantage visible while product protects it.
7. Customer Interview and Feedback Analysis
Customer interviews reveal needs that public competitor research often misses. They explain how people combine products, where workarounds appear, which outcomes matter after purchase, and why a technically impressive capability may have little practical value. Unlike win/loss analysis, this method includes satisfied customers, active users, prospects, and people who use alternative solutions without entering a formal sales process.
Start with a clear sampling plan across relevant segments. An ML engineer may discuss data quality and pipeline integration. A digital agency may care about batch processing and historical access. A researcher or journalist may prioritize retention, export, reproducibility, and responsible handling. These differences should shape both the interview guide and the analysis.
Ask for behavior, not preferences
“Would you use this feature?” produces weak evidence. Ask the participant to describe the last time they completed the task, what they used, what failed, what they did next, and who else became involved. Concrete sequences uncover friction that a preference survey can hide.
Useful prompts include:
- Recent workflow: “Walk me through the last time you collected or analyzed social data.”
- Alternative used: “What did you try before the current solution?”
- Failure point: “Where did the process slow down or require manual work?”
- Decision criteria: “Which requirement would have stopped the purchase?”
- Value test: “What result made the process worth repeating?”
The qualitative research data collection guide can help structure interviews and preserve consistent evidence. Record exact wording with permission, but don't treat one memorable quote as representative. Group findings by segment, frequency, severity, and business consequence, then return the conclusions to product, marketing, and sales teams.
8. Pricing Strategy and Cost Analysis
Pricing analysis is more than copying numbers from competitor pages. It examines what customers pay for, how usage is measured, what limits create friction, and which operational costs sit outside the advertised price. For APIs, compare request-based billing, credits, subscriptions, free access, rate limits, overages, support, implementation work, and the cost of maintaining integrations.
The same headline price can produce very different total costs. A platform requiring separate OAuth implementations may create engineering and maintenance work. A real-time service may charge for every request, while cached responses may change the economics of repeated retrieval. These are hypotheses to test, not assumptions to present as universal advantages.
Compare the full buying equation
Build a pricing model around the customer's workflow:
- Usage unit: Define what consumes credits or requests and whether failed calls count.
- Access conditions: Record trials, payment requirements, minimum commitments, and account approvals.
- Operating cost: Include engineering time, monitoring, retries, storage, and downstream processing.
- Scale behavior: Examine rate limits, volume discounts, enterprise terms, and support expectations.
- Value delivered: Connect the cost to the labor, delay, or infrastructure the product replaces.
A third-party example such as an exportable source code pricing page can show how pricing context appears in adjacent markets, but it shouldn't be used as evidence about another vendor's economics. Capture competitor prices with dates because pages change, and distinguish public list pricing from negotiated enterprise terms. Don't infer willingness to pay from a competitor's price alone. Validate it through interviews, win/loss evidence, and controlled commercial tests.
9. Technology and Architecture Stack Analysis
Technology analysis can reveal why competitors behave differently, but public inspection has limits. Documentation, public repositories, DNS records, job postings, SDKs, and controlled API tests may expose design patterns. They rarely provide a complete view of internal infrastructure, operational processes, or reliability controls. Analysts should label observations as confirmed, strongly indicated, or unknown.
For a social data API, compare a unified REST interface with platform-specific SDKs. Examine authentication flow, naming consistency, pagination, response schemas, retry guidance, caching disclosures, rate-limit behavior, and error messages. These details affect implementation effort more directly than a technology logo on a careers page.
Test the system a buyer actually uses
A practical architecture review can include:
- Interface consistency: Send equivalent requests across endpoints and compare parameters, response shapes, and errors.
- Failure handling: Test invalid inputs, unavailable content, rate limits, and partial results.
- Documentation quality: Follow the setup path without relying on undocumented support.
- Data freshness: Compare cached and live behavior where the product makes that distinction.
- Integration depth: Check export formats, webhooks, SDKs, and compatibility with downstream workflows.
Captapi describes a developer-first REST interface with 34 endpoints, public social data extraction, Apify-backed scrapers with retries, a shared cache, and rate limits that can reach 600 requests per second. Those are product claims that should be assessed against the customer's required workflow, not treated as proof that the architecture is superior in every situation. Architecture analysis is most useful when it connects technical choices to buyer outcomes such as setup effort, reliability, maintainability, and controllable cost.
10. Market Segmentation and Positioning Analysis
Positioning analysis asks who each competitor is trying to win, which problem it emphasizes, and what associations it builds across its website, sales materials, reviews, and public conversations. It exposes white space that feature comparisons often miss. Two companies can offer similar capabilities while targeting different buyers through different language, proof points, packaging, and channels.
Map competitors across direct, indirect, substitute, and AI-native categories before assigning them to a positioning chart. A general developer tool may compete with a specialist API for some searches, while an internal build competes during procurement. AI search adds another lens because competitors may be cited for particular buyer-intent prompts even when they don't dominate traditional rankings. HubSpot's SEO competitor analysis guidance highlights AI citation share as an increasingly important comparison surface.
Connect messages to evidence
Collect the claims competitors repeat across landing pages, demos, webinars, case studies, social posts, and third-party coverage. Then compare those claims with customer language and product tests.
A positioning map for a social data API might use dimensions such as:
- Audience: ML engineers, marketing teams, agencies, researchers, journalists, or creators.
- Promise: Developer simplicity, infrastructure scale, data breadth, automation, or no-code access.
- Proof: Documentation, public examples, customer feedback, technical tests, or integrations.
- Discovery: Organic search, social conversation, communities, referrals, and AI answers.
- Unserved need: A segment or workflow competitors mention rarely or support poorly.
Captapi can collect competitor video transcripts, comments, engagement metrics, and search results across supported platforms, helping teams compare not only what brands publish but how audiences respond. The conclusion should be a testable positioning statement, then validated with interviews, sales conversations, and AI-intent prompts. A message isn't differentiated because it sounds distinctive. It's differentiated when a specific buyer recognizes a meaningful advantage and can verify it.
10-Method Competitor Analysis Comparison
| Method | Implementation complexity 🔄 | Resource requirements ⚡ | Expected outcomes 📊 | Ideal use cases 💡 | Key advantages ⭐ |
|---|---|---|---|---|---|
| SWOT Analysis (Strengths, Weaknesses, Opportunities, Threats) | Low, simple four-quadrant process | Low, minimal tools, cross-functional input | High-level strategic snapshot of competitors and gaps | Quick strategic reviews, quarterly updates | ⭐ Broad overview; fast to run |
| Porter's Five Forces Analysis | High, multi-force industry assessment | Medium–High, industry data and expertise | Structural view of competitive intensity and profitability | Market entry, long-term strategy, pricing decisions | ⭐ Reveals sustainable advantage areas |
| Benchmarking (Performance Comparison) | Medium, standardized metrics and tests | Medium, monitoring tools, automated testing | Objective performance baselines and gap identification | Technical performance tuning, SLA/price comparisons | ⭐ Data-driven, actionable targets |
| Feature Matrix / Competitive Grid Analysis | Low–Medium, structured tabulation | Low, internal knowledge plus periodic research | Clear side-by-side feature positioning and gaps | Sales enablement, product roadmap prioritization | ⭐ Visual clarity; exposes white-space |
| Social Listening & Brand Monitoring | Medium, continuous monitoring and filtering | Medium, listening tools and analysts | Real-time sentiment, trend detection, customer pain points | Marketing intelligence, reputation management, trend spotting | ⭐ Captures authentic customer voice early |
| Win/Loss Analysis | Medium–High, structured interviews/process | High, sales cooperation and interview effort | Concrete reasons for wins/losses and competitor strengths | Sales enablement, closing process and product fixes | ⭐ Based on real buying decisions |
| Customer Interview & Feedback Analysis | High, in-depth qualitative research | High, skilled interviewers, time, sampling | Deep user context, unmet needs, feature priorities | Product discovery, UX improvements, persona building | ⭐ Rich contextual insights; builds customer relationships |
| Pricing Strategy & Cost Analysis | Medium–High, modeling and market comparison | Medium, pricing data, financial modeling tools | Pricing recommendations, elasticity and TCO insights | Pricing changes, packaging, value-based positioning | ⭐ Informs value-based pricing and competitiveness |
| Technology & Architecture Stack Analysis | High, technical forensic analysis | High, engineering expertise and tooling | Technical differentiation, scalability and reliability risks | Technical roadmap, technical due diligence, integrations | ⭐ Reveals architecture-level opportunities/risks |
| Market Segmentation & Positioning Analysis | Medium, messaging and persona mapping | Medium, market research and content analysis | Target segment identification and positioning gaps | Go-to-market strategy, targeted messaging, product-market fit | ⭐ Identifies white-space and target personas |
Turn Competitive Signals Into Decisions
Competitor analysis becomes valuable when it changes a decision. The report itself isn't the outcome. A useful process turns scattered observations into a small set of strategic hypotheses, tests those hypotheses against multiple evidence sources, and assigns an action to each conclusion.
Begin with market structure. Use Porter's Five Forces to identify supplier dependence, buyer power, substitutes, new-entry conditions, and rivalry. Then define the competitor set around the buyer's actual alternatives. Separate direct rivals from indirect solutions, internal builds, native platform tools, and AI-native products. This prevents the team from optimizing against the wrong comparison group.
Next, create hypotheses through SWOT and positioning analysis. For example, you might believe customers choose a unified API because they want to reduce integration complexity. That hypothesis needs more than a feature grid. Benchmark the onboarding path, inspect documentation, review win/loss notes, and ask customers how they evaluated authentication and maintenance. If the evidence conflicts, preserve the conflict rather than forcing a neat conclusion.
Use benchmarking and feature matrices for observable comparisons. Record the test date, source, conditions, and confidence level. Public claims, controlled tests, customer statements, and social comments don't carry the same evidentiary weight. A strong report makes that distinction visible.
Pricing analysis should then connect commercial terms to actual workflows. Compare usage units, limits, support, setup effort, and downstream costs. Customer interviews and win/loss research can show whether buyers care about the differences enough to switch. Social listening can reveal emerging complaints or language, but analysts should sample and verify conversations before turning them into roadmap decisions.
Assign owners to each evidence stream. Product can maintain capability tests, marketing can monitor messaging and AI citation share, sales can code win/loss themes, and research or operations can maintain source records. Schedule updates according to market volatility rather than habit. Platform-dependent APIs may need closer monitoring than a stable category framework.
Captapi is one option for operationalizing public social and video-data monitoring. Its unified REST interface can collect transcripts, summaries, comments, engagement metrics, channel or page details, and search results across supported platforms. Teams still need to respect platform rules, customer privacy, applicable law, and the responsibilities that come with storing and analyzing extracted public data.
Finish every review with explicit actions. Product might prioritize a missing endpoint, marketing might build content around an evidenced information gap, sales might revise qualification questions, and leadership might change packaging or support commitments. Include the expected decision, owner, evidence threshold, and review date. That turns competitor analysis methods from an archive of observations into a repeatable operating system for strategy.
Captapi gives teams one REST interface for collecting public social data from YouTube, TikTok, Instagram, and Facebook, including transcripts, comments, engagement metrics, summaries, and search results. Use it to support competitor benchmarking, social listening, and evidence collection, then visit Captapi to explore the API and start building a repeatable research workflow.