
Competitor Analysis Marketing That Turns Data Into Wins

Your team has spent weeks building a campaign around a clear market opportunity. Then a competitor launches an almost identical offer, claims the conversation, and gives sales a new objection to handle. The problem usually isn't a lack of data. It's that the data arrives as scattered screenshots, occasional SEO checks, and opinions in a weekly meeting.
Competitor analysis marketing works when it becomes a decision system. You monitor a defined peer set, compare signals consistently, and connect changes in competitor behavior to positioning, pricing, content, channel, and sales actions. That approach reaches beyond website audits and keyword rankings into public conversations, creator ecosystems, comments, and the semi-closed spaces where buyers increasingly discuss products.
Table of Contents
- Why Competitor Analysis Marketing Matters Right Now
- Define Your Goals and Choose the Right Competitors to Track
- Build a Focused Scorecard With Metrics That Drive Decisions
- Collect Social Data at Scale With Captapi Workflows
- Turn Signals Into Insights and Action Across Dark Social
- Keep Your Edge With an Always On Review Rhythm
Why Competitor Analysis Marketing Matters Right Now
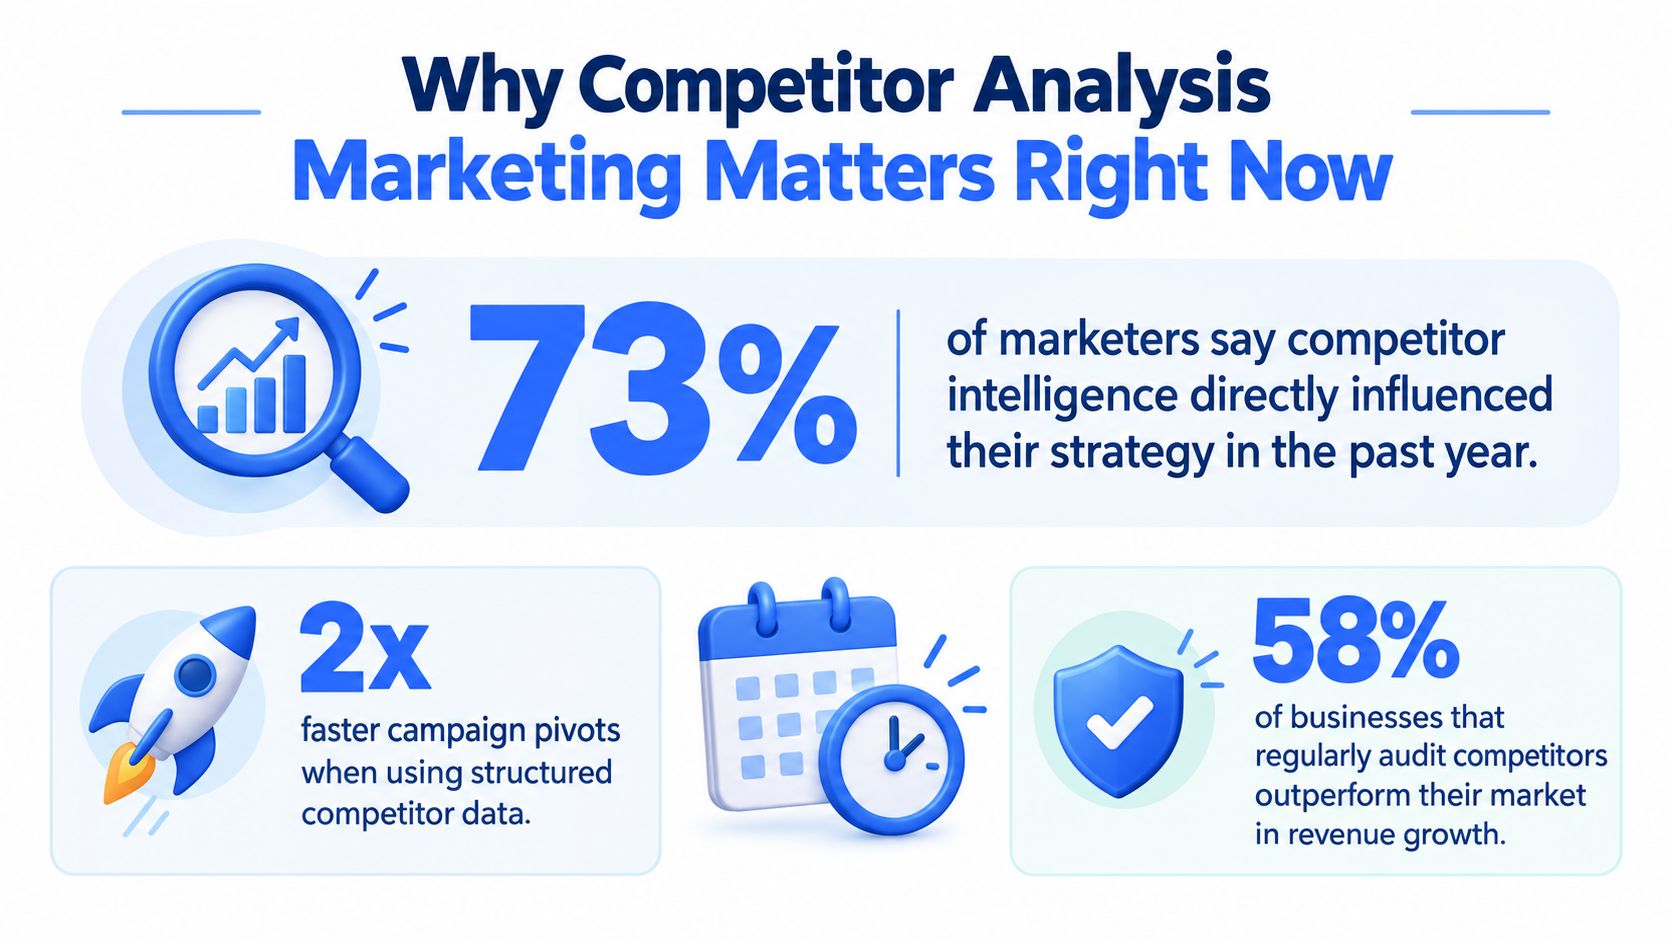
Large companies already treat competitive intelligence as an operating capability rather than a research project. One industry summary reports that 90% of Fortune 500 firms use competitive intelligence to gain an advantage, while another estimate values the global competitive intelligence market at USD 50.87 billion in 2024, with a projection of USD 122.77 billion by 2033, implying a 9.1% CAGR from 2025 to 2033. These figures come from the industry summary of competitor analysis statistics.
That shift changes the standard for marketing teams. A quarterly PDF that lists competitor headlines can't support decisions about a live campaign, a pricing change, or a new product launch. Teams need recurring intelligence that shows what rivals are saying, where they're distributing it, how audiences respond, and whether those signals affect the funnel.
The practical difference is easy to see. A marketer who checks competitor landing pages once a quarter may notice a new package after it has become familiar to buyers. A marketer who reviews offers, ad messages, social posts, comments, and review themes each week can identify the change while it's still a test. The second marketer doesn't copy automatically. They ask whether the rival has exposed a demand signal, addressed an objection, or created a positioning risk.
Working principle: Competitive data has value only when someone can connect it to a decision with an owner and a deadline.
Manual benchmarking still has a role, especially for understanding nuance. It fails when analysts try to track every rival, every platform, and every metric without a scoring system. The result is a large archive with no clear answer to “What should we do next?”
A focused system combines human interpretation with automation. Teams evaluating automation options can use this guide to AI tools for competitor analysis, especially when they need help summarizing repeated themes across large amounts of public content. For the broader distinction between observation and an ongoing intelligence program, see what competitive intelligence means in practice.
The operating model is straightforward: define the question, choose the right rivals, collect comparable signals, diagnose the cause of a gap, and assign an action. The remaining sections turn that model into a repeatable workflow.
Define Your Goals and Choose the Right Competitors to Track
A weekly review often fails before data collection begins. The team opens a monitoring tool, gathers competitor posts and rankings, then cannot explain which decision the findings should support. Start with the business decision instead. “Monitor competitors” is too broad to guide interpretation. Ask, “Why are we losing qualified opportunities to this alternative?” or, “Which competitor messages are shaping demand for this product category?”
Write the decision in one sentence and connect it to a funnel stage. Awareness questions may require share of voice, search demand, creator activity, topic coverage, and social distribution. Consideration questions often require pricing pages, feature comparisons, reviews, transcripts, and comment themes. Conversion questions can depend on offers, guarantees, onboarding language, sales follow-up, and recurring objections.
Comment ecosystems deserve a place in the brief. Public replies can show objections and use cases that never reach a landing page, while private shares and closed-group discussions create a dark social gap that surface engagement metrics cannot measure directly. Treat visible comments as directional evidence, then compare them with referral patterns, sales notes, and customer interviews rather than assuming likes represent demand.
Build a tiered peer set
A practical starting point is 5 to 10 direct and adjacent competitors, as recommended in this competitor benchmarking workflow. The range reveals market patterns without making every comparison too difficult to maintain.
Use three tiers:
- Direct competitors: They solve a similar customer problem for a similar audience. Review these most closely because buyers are likely to compare them with you.
- Adjacent competitors: They target the same audience with a different solution. Their pricing logic, formats, and category language can change customer expectations.
- Aspirational or emerging players: They may not compete for the same deal today, but they can reveal new distribution methods, product narratives, or audience behaviors.
Keep deep coverage narrower than the full watchlist. Concentrate detailed monitoring on 3 to 5 key rivals, and use 10 to 15 metrics across at least three categories so collection stays tied to decisions. A competitor monitoring software guide can help determine which recurring checks belong in automation, including social surfaces and comment queries.
Decide who earns a place
Put a competitor on the deep-track list when sales encounters it in active buying conversations, its offer overlaps with your primary use case, or its message influences the audience you need to reach. An adjacent player earns attention when it changes the customer's reference point, even if the product looks different.
Remove names that produce no actionable contrast. A famous brand can consume research time without improving a decision if it does not share your audience, price context, or buying journey. A video strategy case study shows the value of analyzing a defined content and channel context rather than treating every market participant as equally relevant.
Keep a short rationale beside every competitor name. Record its tier, the decision it informs, and the condition that would cause you to add or remove it. That note keeps the watchlist maintainable as the market changes.
Build a Focused Scorecard With Metrics That Drive Decisions
A useful scorecard answers three operational questions: where is the gap, how large is it, and what might explain it? Every metric should support a decision, such as changing a message, prioritizing a content brief, revising an offer, or investigating a sales objection. A scorecard that stores every observable detail becomes a reporting archive rather than a working tool.
Start with 10 to 15 metrics across at least three categories, then keep detailed monitoring focused on 3 to 5 key rivals. Combine search demand, visibility, social response, customer feedback, and commercial signals. Normalize observations before comparing them. Seasonal campaigns, unusual ad spend, product launches, and platform-specific distribution can distort raw results, so record the context and compare like with like.
Use the median of the selected peer set as the reference point, rather than relying on one unusually strong or weak competitor. Flag a gap greater than 10% versus the median for review. This threshold is a screening device, not an explanation. Analysts still need to test what caused the difference, using a consistent competitor analysis benchmarking method.
Use categories that map to decisions
Search and visibility metrics show whether competitors cover demand your content does not address. Social metrics reveal whether a message travels across feeds and comment ecosystems, including questions and objections that website audits miss. Review and conversation data expose customer language that may never appear on a landing page. Pricing and offer signals clarify the commercial frame buyers encounter.
| Category | Metric | Signal to Track | Action Trigger |
|---|---|---|---|
| Search demand | Topic and query coverage | Themes competitors address that your brand does not | Prioritize a content or product education gap |
| Visibility | Share of voice | Relative presence for important category topics | Investigate channel, content, or brand coverage |
| Social engagement | Comments and meaningful responses | Audience questions, objections, and recurring reactions | Update messaging or create objection-handling content |
| Social performance | Engagement velocity | How quickly a post attracts reactions compared with peers | Examine format, timing, hook, and distribution |
| Video | Transcript themes | Repeated claims, use cases, and proof points | Compare narrative positioning |
| Reviews | Recurring praise and complaints | Customer language around strengths and friction | Feed positioning, product, and sales enablement |
| Pricing | Package structure and offers | Premium, mid-market, entry, bundle, or incentive patterns | Reassess price communication and value framing |
| Funnel | Visit to MQL to SQL to Win | Movement through the funnel relative to competitor context | Connect market signals to conversion analysis |
| Sales | Cycle time and objections | Friction points associated with alternatives | Create a targeted response for sales teams |
The table combines leading and lagging signals. A new competitor theme can provide an early warning, while win and loss movement indicates whether that theme affects revenue. Treat high engagement as evidence of attention, not business impact. A controversial post may attract comments without increasing qualified demand.
Diagnose the driver behind a gap
After the scorecard flags a difference, test possible causes: content coverage, channel mix, offer design, territory coverage, brand awareness, or sales execution. Weaker social response may result from limited distribution rather than weak creative. Lower conversion may reflect pricing clarity, proof, or sales follow-up rather than a product deficit.
Review the post, transcript, comments, and offer context together before assigning an action. The scorecard earns its place when the team can challenge a signal, identify a likely driver, and assign an experiment. Keep the method short enough for a weekly review, while preserving the context needed to interpret changes.
Collect Social Data at Scale With Captapi Workflows
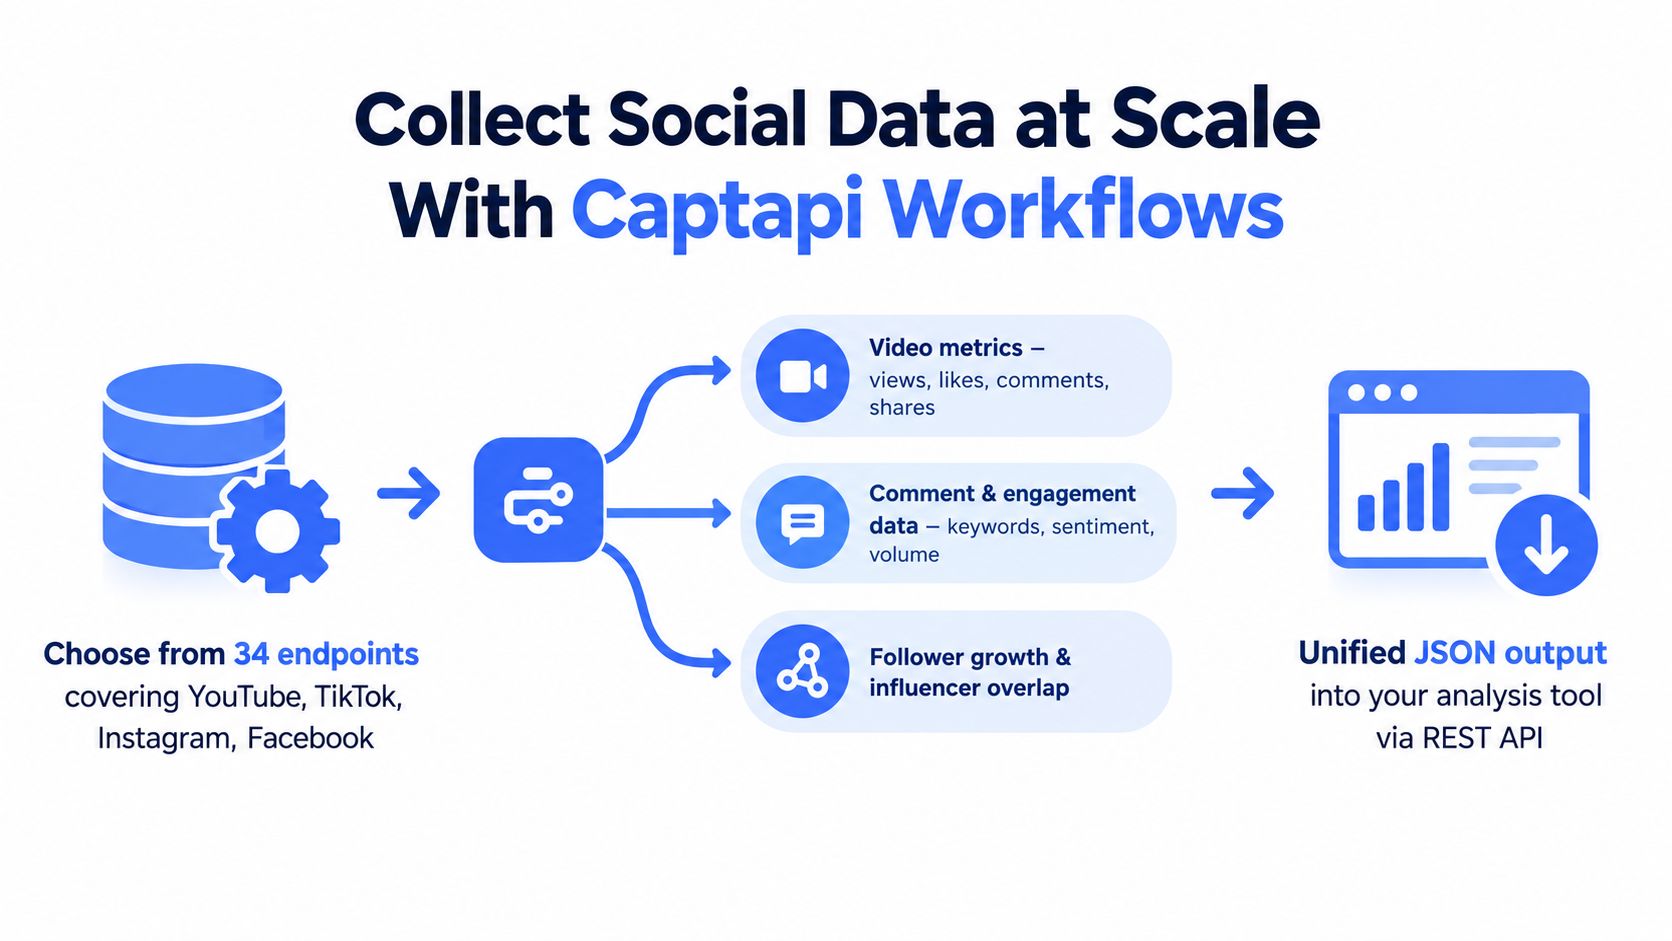
Website and SEO data show what a competitor publishes on owned surfaces. Social data shows how the audience reacts, which questions keep returning, and which claims attract attention across formats. A practical collection workflow should cover YouTube, TikTok, Instagram, and Facebook without forcing analysts to maintain separate OAuth flows, SDKs, and output formats.
Captapi provides a REST interface with 34 endpoints for these platforms, including transcripts, summaries, comments, engagement metrics, downloads, channel and page details, search, and ad intelligence. The workflow can use endpoints for a specific task, then send unified JSON into a warehouse, notebook, dashboard, or retrieval pipeline.
Pull the source data first
Begin with stable identifiers for each competitor. For YouTube, collect channel details, videos, comments, and transcripts. For TikTok, Instagram, and Facebook, collect public posts, engagement fields, comments, and search results relevant to the competitor or topic.
A basic request pattern might look like this:
GET /v1/youtube/channel?handle=@competitor
GET /v1/youtube/comments?video_id=VIDEO_ID
GET /v1/youtube/transcript?video_id=VIDEO_ID
Use the corresponding platform endpoint for TikTok, Instagram, or Facebook, then store the platform, competitor, content identifier, publication time, text, and engagement fields together. Standardized fields make cross-platform analysis possible without pretending that a view on one platform means exactly the same thing as a view on another.
Add summaries and comment analysis
Transcripts are useful for comparing what competitors say at scale. A summary endpoint can reduce long videos to recurring topics, claims, calls to action, and named products before an analyst reads the source material.
For example:
GET /v1/youtube/summarize?video_id=VIDEO_ID&model=gpt-4o-mini
For comments, export the raw text before summarizing it. Preserve the original comment, timestamp, platform, content identifier, and any available engagement context. Then classify recurring themes such as pricing confusion, feature requests, implementation concerns, competitor comparisons, or positive outcomes.
A reliable workflow also schedules retries and respects rate limits. Captapi uses Apify-backed scrapers with retries, a 24-hour shared cache for repeat requests, and rate limits of up to 600 RPS, according to the product information supplied for this article. Cached responses are especially useful when several analysts or pipeline stages request the same public object. They reduce duplicate work and help teams reuse collected data in dashboards, summaries, and research workflows.
Schedule collection around decisions
Don't pull everything at the highest frequency. Schedule lightweight checks for new posts, comments, and ads, then reserve transcript extraction and deeper summarization for content that crosses a relevance threshold. Keep raw responses, normalized records, and generated summaries separate so analysts can audit an insight back to the source.
This structure also supports RAG, video question answering, reporting, and OSINT workflows. Teams designing a reusable extraction layer can use data pipeline automation for social intelligence as a reference point for separating collection, processing, storage, and analysis.
Turn Signals Into Insights and Action Across Dark Social
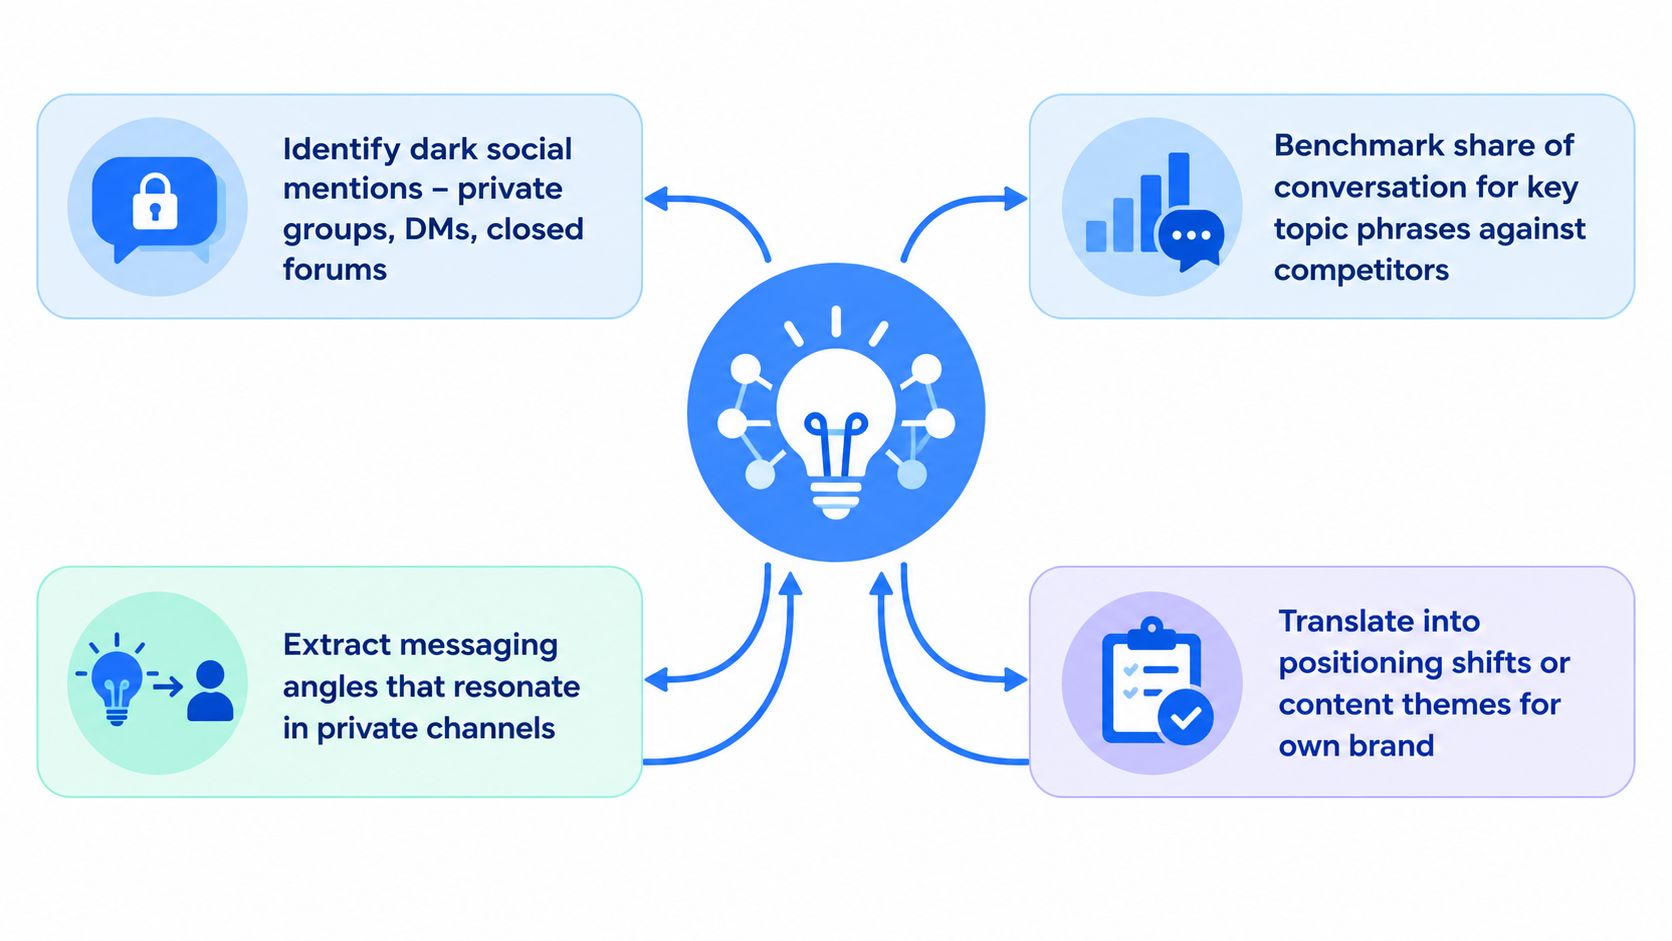
Most competitor playbooks stop at websites, search rankings, public ads, and open social feeds. That misses the conversations that happen in WhatsApp, Discord, Telegram, private Facebook groups, creator comment ecosystems, and other semi-closed surfaces. You shouldn't bypass access controls or collect private data without authorization, but you can analyze public comments, approved exports, creator discussions, and other data your organization is permitted to handle.
The dark social gap matters because buyers often ask practical questions in community contexts rather than on a brand's landing page. They compare implementation effort, support quality, pricing fairness, and real-world reliability in language that marketers may not find in public product copy.
Benchmark conversation, not just activity
Start with a defined topic vocabulary. Include product categories, competitor names, use cases, objections, alternatives, and customer-language variants. Compare how often each competitor appears in relevant public conversations, then examine the surrounding meaning.
A high volume of mentions doesn't automatically indicate preference. Separate:
- Presence: Which brands appear in discussions about the topic?
- Context: What problem, comparison, or question surrounds each mention?
- Reaction: Do replies support, challenge, or qualify the original claim?
- Momentum: Are new conversations repeating the same theme?
- Resolution: Does the competitor answer the question clearly, or do other users fill the gap?
Use transcript themes to understand planned messaging and comment themes to understand audience interpretation. The difference between those two surfaces is often more actionable than either measure alone. A competitor may claim simplicity in its videos while commenters repeatedly ask about setup, migration, or support.
Connect the insight to a move
A useful decision matrix keeps analysis from becoming a sentiment report.
| Observed signal | Likely interpretation | Marketing response |
|---|---|---|
| Competitor dominates a topic but comments reveal confusion | Strong reach, weak clarity | Publish clearer education and objection-handling content |
| Your brand appears rarely in relevant public discussions | Visibility or distribution gap | Build creator, community, or partner content around the topic |
| Rival praise centers on a feature you also offer | Messaging gap | Make the capability more prominent and prove it with examples |
| Rival complaints repeat around price or support | Unresolved customer pain | Test a clearer value frame, service promise, or comparison asset |
| Comments compare several alternatives without naming a leader | Category opportunity | Define the buying criteria and position around the strongest fit |
Do not copy the competitor's wording just because it performs. Extract the underlying customer need, then express it in a defensible way for your product. For a deeper approach to connecting social conversation with brand perception, see brand sentiment tracking.
The output should be a short action brief: the observed signal, evidence, suspected driver, proposed move, owner, and review date. That format makes dark social analysis useful to product marketing, content, paid media, and sales rather than leaving it with the analyst.
Keep Your Edge With an Always On Review Rhythm
A competitor program becomes durable when the cadence is lighter than the research burden. Weekly reviews should surface changes, not recreate the entire market. Monthly reviews can investigate the strongest signals, while quarterly sessions should challenge whether the peer set, scorecard, and positioning assumptions still fit the market.
Run the operating cadence
Weekly checks should cover new competitor posts, notable ads, comment spikes, transcript themes, pricing changes, and emerging objections. Keep the review short and ask one question: “What changed that could affect a decision we're making now?”
Monthly analysis should compare normalized metrics, inspect flagged gaps, and select a small number of experiments. Analysts should bring source records, not just conclusions, so channel owners can validate the interpretation.
Quarterly reviews should revisit competitor tiers, remove irrelevant names, add emerging players, and test whether the scorecard still maps to funnel outcomes. This is also the right point to compare win/loss notes with the intelligence program and identify blind spots.
Keep the system disciplined
Use a single owner for the watchlist and a named owner for every action. Limit the scorecard to the compact range described earlier, and document why each metric remains. Store raw social records separately from summaries, preserve collection dates, and label public versus authorized data sources.
A weekly review that changes a campaign, sales asset, or product message is more valuable than a quarterly report nobody uses.
Automation should remove repetitive collection, not replace judgment. Reuse cached pulls where appropriate, feed transcripts and comments into approved RAG or reporting pipelines, and keep human review for sensitive interpretation, privacy decisions, and positioning changes. Captapi's free tier includes 100 lifetime credits, with credit-based plans for larger workflows, so teams can test a focused collection process before designing a broader pipeline.
Start with one decision, one direct competitor, one adjacent competitor, and a scorecard your team can explain. Review the first set of signals with sales and content owners, then expand only when the evidence shows that another source or competitor will change an action.
Captapi provides public social data through one REST interface across YouTube, TikTok, Instagram, and Facebook, including comments, transcripts, summaries, engagement metrics, search, and competitor ad intelligence. Visit Captapi to test the free credits, pull a focused competitor dataset, and connect the output to the workflow your marketing team already uses.