
Competitive Analysis for Social Media That Actually Works

Monday morning hits, and the social team opens five dashboards that all seem to disagree. One competitor looks dominant because its posts get strong reactions, another looks weak because its follower base is bigger, and a third looks “quiet” until you notice its content is being pushed on a platform where the normal baseline is different. By the end of the meeting, nobody knows what to test next.
That's the failure mode most competitive analysis for social media workflows fall into. They turn public data into a leaderboard, then confuse a leaderboard with a decision system.
The fix is to stop asking which brand has the prettiest ratio and start asking which competitor is winning under the same conditions. That means choosing a tight rival set, normalizing by platform and audience size, tagging content by format and objective, and turning the results into one controlled test. When the data is collected and scored this way, competitor analysis stops being a reporting ritual and starts becoming a weekly operating tool.
The practical payoff is simple. You can tell whether a rival's apparent momentum is real, whether a format is repeatable, and whether your own next move should be a hook change, cadence shift, or platform reallocation. You also avoid the common trap of treating follower-based engagement as a universal quality score, even though the denominator can favor dormant accounts and punish accounts with strong reach but smaller follower counts.
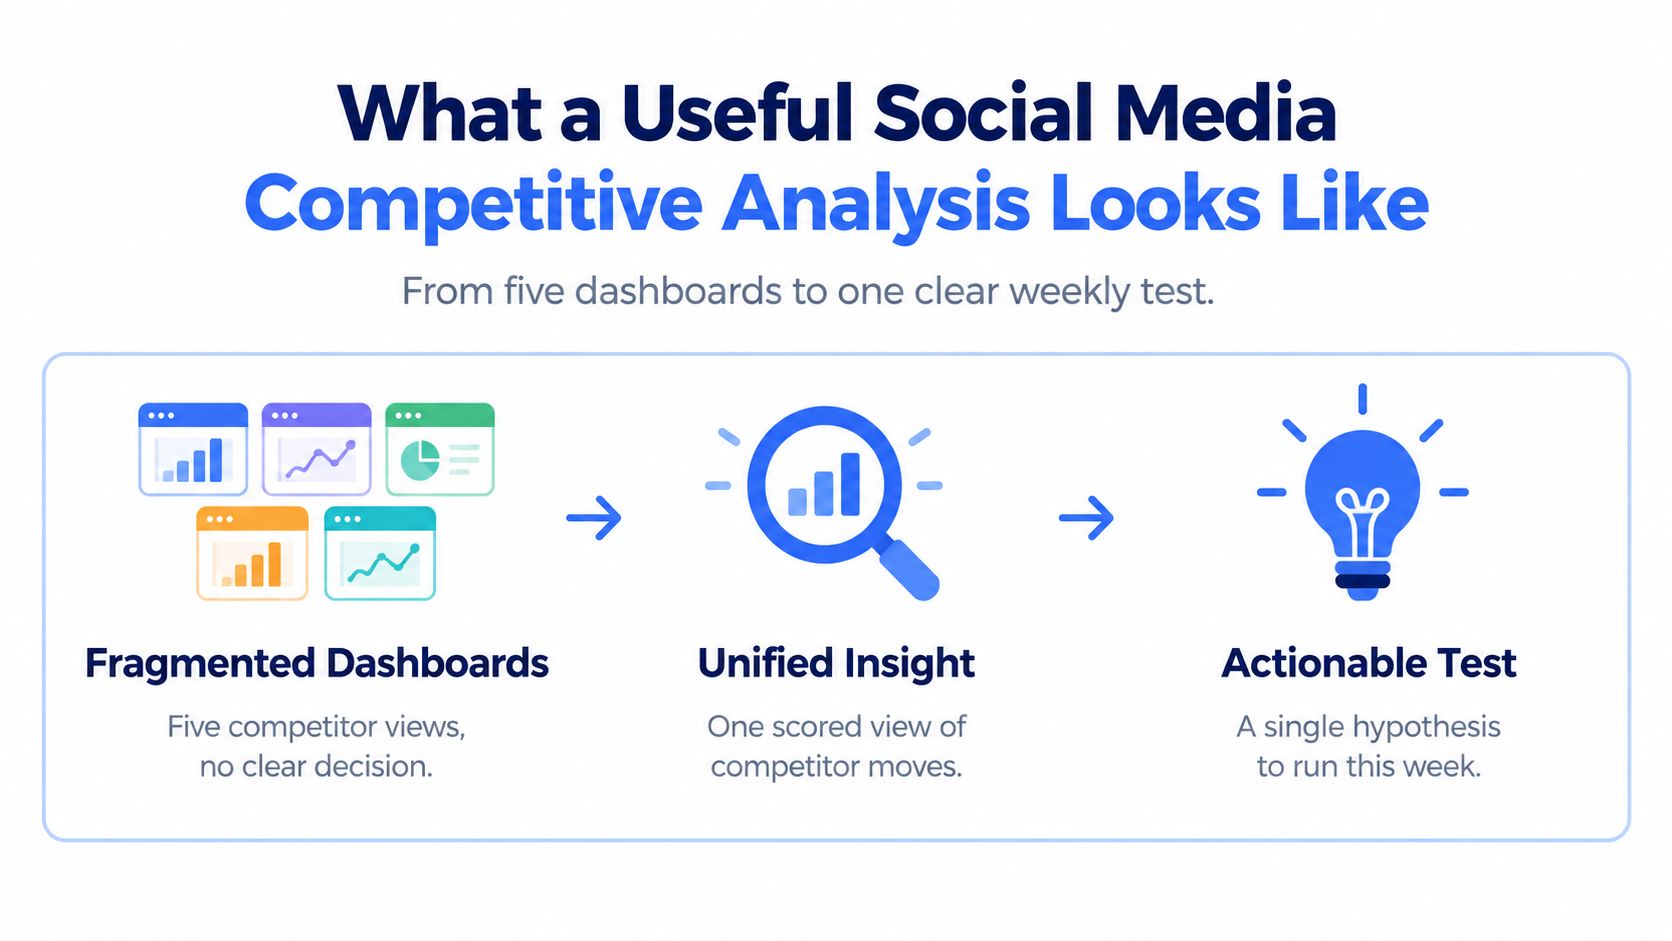
Table of Contents
- What a Useful Social Media Competitive Analysis Looks Like
- Building Your Competitor Set and Reference Baselines
- Collecting Social Media Data with a Unified API Layer
- Tagging the Content Portfolio and Scoring Performance
- Turning Insights into Alerts, Reports, and Testable Hypotheses
- Matched-Cohort Analysis vs the Leaderboard Trap
- Rollout Checklist and Common Pitfalls to Avoid
What a Useful Social Media Competitive Analysis Looks Like
A useful review starts with a familiar mess. The team has five competitor dashboards open, each showing a different platform, a different metric definition, and a different story. One rival's TikTok looks strong on engagement, but that number is hard to read without platform context, format mix, and audience quality. Buffer's benchmark compilation puts median monthly volume at 35 Facebook posts, 17 Instagram posts, and 8 to 9 TikTok posts, with median engagement around 3.6% on Facebook, 4.3% on Instagram, 4.86% on TikTok, and 6.5% on LinkedIn reported in Buffer's social media benchmarks report.
Why the leaderboard breaks
A single engagement leaderboard fails for three reasons. Platform formulas do not match, so a post can look stronger only because the network exposes different interaction types. Follower-based ratios can flatter dormant accounts with tiny recent activity. Cross-format comparisons distort reality, because a short video and a static image do not earn attention in the same way.
The better move is to compare like with like, then use those comparisons to form testable hypotheses. That is the point of competitive intelligence overview on Captapi's blog, and it is also how scheduling and legal guardrails for CI data keep the workflow usable instead of messy. A competitor with a lower absolute rate may still be outperforming its own platform baseline, while a higher rate can just reflect a smaller audience or a different measurement method.
Practical rule: never review a competitor without preserving the denominator, whether that is followers, impressions, reach, or views.
The operational answer is a four-part workflow. Pick the right rivals. Normalize the metrics. Tag the content portfolio. Ship one controlled test. If the report cannot tell you what to try next, it is just a prettier spreadsheet.
Genuine value comes from matched cohorts, not raw rank order. Compare brands with similar audience size, format mix, and posting behavior, then ask which message, creative pattern, or cadence shift is working inside that cohort. That is where a social media competitive analysis becomes a weekly decision tool instead of a vanity report.
Building Your Competitor Set and Reference Baselines
A social benchmark breaks fast when you compare everyone to everyone. A DTC brand with regional pages, a SaaS company built around executive thought leadership, and a creator account do not publish into the same conditions, so the competitor set has to be defined before any scoring starts. The cleanest setup uses three baselines, your own trailing history, an industry aggregate split by platform and follower tier, and a small group of direct rivals.
Choose rivals by overlap, not curiosity
Use blunt selection criteria. Match on audience size, geography, category, and account maturity. If a brand runs several regional pages, compare those pages against similar regional accounts. Do not mix a global brand page with a local market account unless the audience and posting model line up closely.
| Criterion | Why it matters | Recommended threshold |
|---|---|---|
| Audience size overlap | Prevents comparisons that reward scale or punish small accounts | Same follower tier band where possible |
| Geography | Audience behavior changes by market | Same primary market or language |
| Category | Different buying cycles produce different content mixes | Same product category or adjacent need state |
| Account maturity | Newer accounts can distort trend lines | Similar age or posting history |
| Posting activity | Sparse accounts are unstable benchmarks | Active enough to support 90 days of analysis |
A set of 3 to 5 direct rivals keeps the view tight enough to act on. Your own trailing 6 to 12 months adds enough internal context to show whether a shift is real or just a short-lived spike. That range lines up with the benchmarking workflow described in Improvado's social media benchmarking workflow, but the useful part is the habit, not the headline number.
A rival set should be chosen for comparability, not for drama. If one account posts like a publisher and another posts like a product brand, the ratio will lie to you.
A gap-finding pass should also check whether the content mix leaves clear holes. The Taja AI content gap guide is useful here because it keeps the review focused on comparable accounts instead of drifting into a list of interesting ones.
The companion reference for this stage is the competitor analysis and benchmarking guide on Captapi's blog. Set the frame first, then pull data into it. If the frame is wrong, the scoring will still be wrong.
Collecting Social Media Data with a Unified API Layer
The collection step should feel boring. If it feels exciting, the workflow is probably too manual. The analyst needs post-level data, audience-size snapshots, and enough metadata to classify content without re-reading every caption by hand.

The fields that actually matter
Collect the same core fields for every post. That usually means platform, URL, timestamp, caption or transcript, media type, engagement counts, follower snapshot, comments, shares, saves where available, and any visible branded or topical tags. If you want useful comparisons, also store posting frequency, format, topic, hashtag set, and a flag for whether the post appears organic or paid.
A unified API layer helps because it reduces the number of moving parts. Captapi, for example, exposes one REST surface for public social data across YouTube, TikTok, Instagram, and Facebook, so the analyst doesn't need separate OAuth flows and SDKs for every platform. In practice, that means pulling channel details for one competitor, listing recent TikTok posts, fetching Instagram media, or searching Facebook pages through the same pattern. The internal social media API overview is useful for understanding that workflow.
For bulk work, engineering choices matter as much as the data model. If you're using browser stacks and proxies, the trade-off space is summarized well in the web scraping tools guide from Clearcote Labs. That context matters when your collection job needs to hold up under repeat pulls and pagination.
A few implementation details make the workflow smoother. Captapi's product notes mention credit-based pricing, a free-tier onboarding path, a 24-hour shared cache for repeat pulls, and rate limits that support bulk exports. Those are workflow considerations, not strategy on their own, but they change how quickly analysts can refresh a competitor set.
The short version is this. Build one schema, collect one clean snapshot per post, and keep the fields comparable across platforms. If the raw table isn't stable, nothing downstream will be.
Tagging the Content Portfolio and Scoring Performance
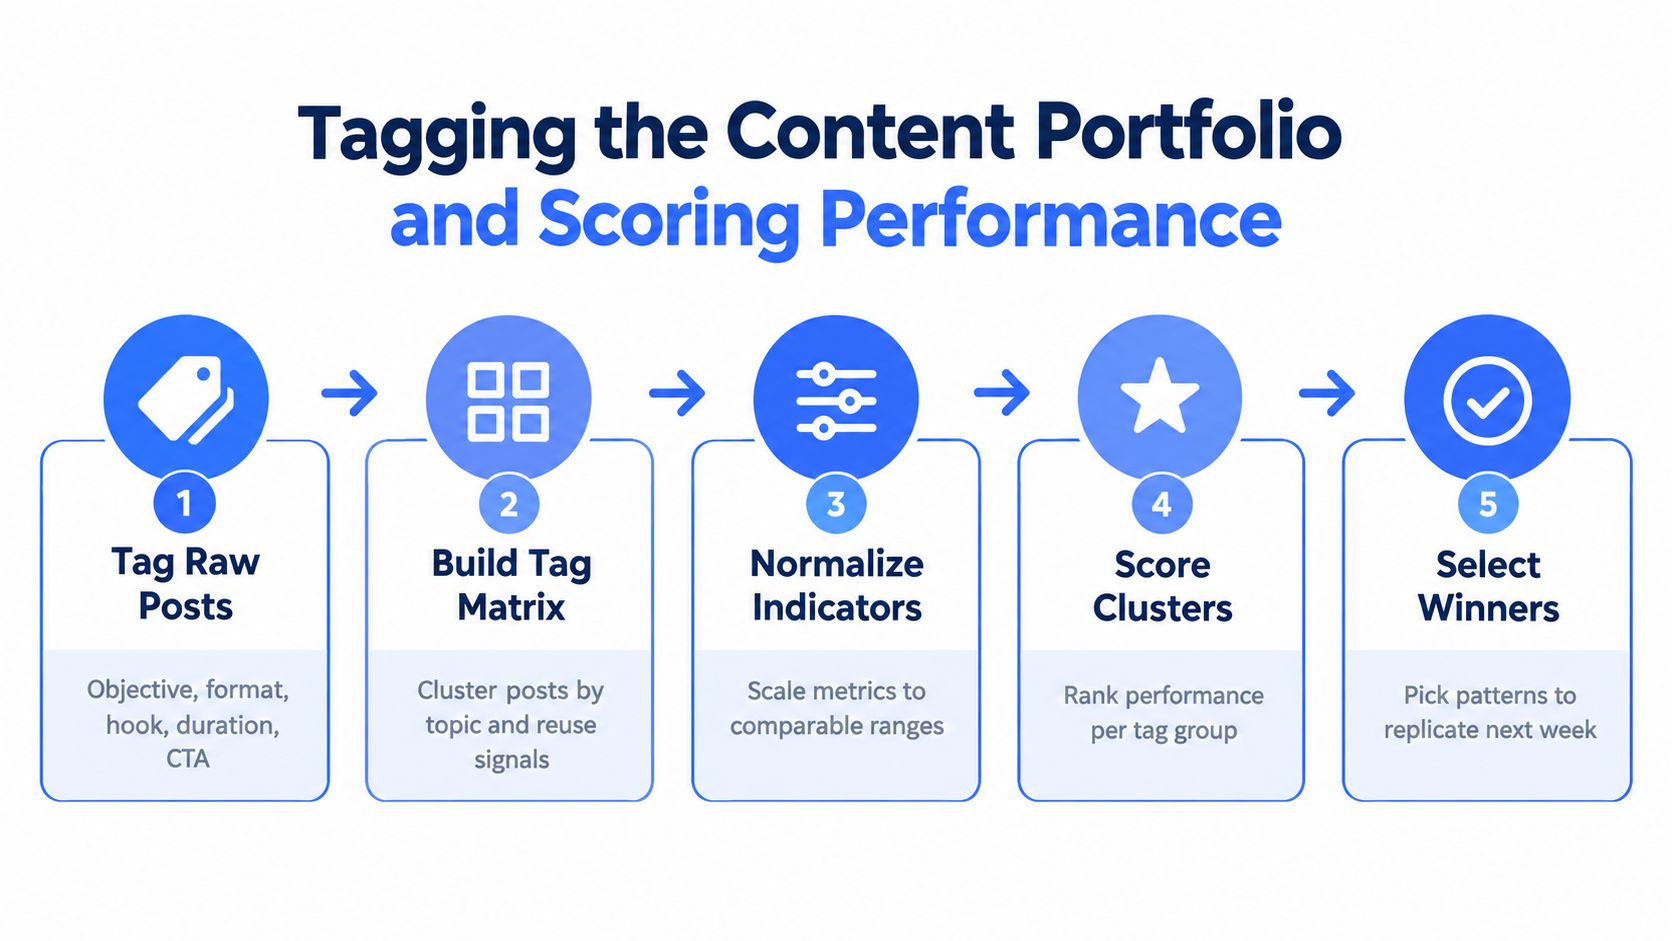
A raw post feed hides the pattern. Once content is tagged into a portfolio view, the real work begins, because the useful unit is the cluster, not the isolated post. Tag each item by objective, format, hook, duration, caption style, CTA, topic, and reuse signals, then compare like with like. That is where competitor analysis stops being a leaderboard and starts showing repeatable behavior.
Score the cluster, not the post
The common follower-based rate, (likes + comments + shares + saves + reactions) / followers × 100, belongs in its own bucket. Keep it separate from reach-based or view-based rates, because mixing them makes cross-platform comparisons noisy. The earlier benchmark discussion already showed why a low visible ratio can still be healthy when a platform distributes content differently.
Medians usually beat averages for competitor portfolios. A few viral posts can pull a mean far away from typical performance, while the median stays closer to what the account does week to week. I also look for top-quartile clusters, then check whether those wins repeat around the same hook, topic, or CTA.
A minimum sample of roughly 30 posts is a practical floor for engagement comparisons, and 90 days is a workable window for trend work, according to Improvado's benchmarking guidance on sample sizes. Smaller samples swing too hard on one unusual post. One strong reel is a spike, not proof of capability.
Platform formulas should stay separate too. Facebook engagement uses reactions, comments, and shares. Instagram uses likes and comments. TikTok includes likes, comments, shares, and saves. As documented by Socialinsider, platform-specific formulas matter because one formula across every network creates false advantages.
A clean tagging matrix makes this easier to trust. The content performance metrics guide is a useful reference point for the fields and comparisons that help analysts separate luck from repeatable performance.
Do not call a format a winner until it repeats. One hit is noise. Three strong posts across different weeks start to look like a pattern.
Turning Insights into Alerts, Reports, and Testable Hypotheses
Scored data only matters if it reaches the team while it can still shape a decision. Weekly alerts should surface competitor spikes, unusual posting bursts, and brand mentions that shift the conversation. Monthly reporting should compress the noise into content clusters, not individual posts, so leaders can see which playbooks are gaining ground and which ones are fading.
Build the operating rhythm
A useful alert has three parts: the signal, the context, and the reason it matters. If a competitor suddenly posts more often on one platform, record the platform, the format, and the content theme. If your brand appears in a recurring thread, route that into the team that can reply, produce follow-up content, or adjust the message.
Captapi's tracking use cases fit this stage because public competitor data, brand-mention monitoring, transcripts, and bulk-exported comments can all feed downstream analysis. That matters when a team wants to push transcripts into another workflow or inspect comment clusters as part of OSINT-style review. The internal reporting automation guide is useful if the reporting layer needs to keep pace with the collection layer.
Each insight should become a testable hypothesis. State the tactic, the mechanism, the primary KPI, and the guardrail. Then compare it against a control period or a matched content set. If the hypothesis cannot be tested cleanly, it is too vague to act on.
Benchmarks are directional, not causal. Public data does not reveal paid distribution, audience quality, deleted posts, or algorithmic targeting, so treat every benchmark as directional.
The cadence should stay simple. Alert weekly, report monthly, re-benchmark quarterly. Slower than that, and competitors can move without consequence.
Matched-Cohort Analysis vs the Leaderboard Trap
A leaderboard feels decisive because it sorts everything into one rank order. It also hides the part that matters: whether two posts were ever comparable. A matched cohort fixes that by holding platform, format, follower tier, and observation window constant, then comparing like with like.
What changes when the sample is matched
Once the sample is matched, raw rank order often stops being useful. A competitor can show a lower visible engagement rate and still deliver stronger reach proxies, more saves, more shares, or healthier comments per follower if the content is traveling farther or attracting better intent. That is the signal worth studying.
The platform baselines and cadence differences documented earlier explain why the same raw rate means different things on different networks. A simple worked example makes it obvious. Competitor A may beat Competitor B on the headline engagement rate, but if A is posting in a crowded format with weaker audience quality and B is outperforming inside the same format and follower tier, the rank flips once the cohort is matched. The conclusion changes with it. The question is no longer who won the leaderboard, but which pattern deserves a test in your own account.
That is why the useful output is a hypothesis, not a trophy. If the matched cohort points to stronger comments, saves, or reach proxies, study the creative mechanism behind those posts and run a controlled comparison against your own baseline.
The goal is not to crown a winner. The goal is to find the tactic worth testing under your own constraints.
Matched cohorts also keep budget decisions honest. They stop teams from shifting spend because one loud post looked better in isolation. Once the comparison is normalized, the next question is practical, which format, hook, or content angle should enter the next controlled trial?
Rollout Checklist and Common Pitfalls to Avoid
The first cycle should be small and disciplined. Define the rival set, lock the three baselines, pull public data through one API, tag the portfolio, score the clusters, build alerts, write one hypothesis, and schedule the next re-benchmark. If the team can't do that in a repeatable way, the process is too fragile to trust.
Common failure modes
- Tiny samples: If a competitor only has a handful of posts, one unusually strong item can warp the result. The fix is to wait for a usable post set before ranking performance.
- Cross-format comparisons: Don't put TikTok video performance next to Instagram static post performance and call it a fair contest. Keep format and platform separate, then compare medians inside each bucket.
- Survivorship bias: A viral post can make a weak content system look strong. Require repeat evidence before labeling a format as a capability.
- Follower obsession: High follower counts don't guarantee strong performance, and low follower counts don't automatically mean weakness. Normalize by audience size and keep reach, views, and follower-based rates in separate lanes.
- Copying one winner: A single breakout post is not a strategy. Look for repeated patterns across weeks before you clone anything.
Ownership and cadence
The analyst or growth lead should own the scoring, the content strategist should own the hypothesis, and the channel manager should own the test. Review weekly for alerts, monthly for trend shifts, and quarterly for the baseline reset. Refresh the rival list whenever the market changes materially, when a new platform starts to matter, or when a competitor's audience overlaps yours more closely than before.
If you want the cleanest next step, start with one platform and one matched cohort. That keeps the workflow manageable and makes the first decision easier to defend.
If you want to stop stitching competitor data together by hand, Captapi gives you one API for pulling public social data across the major platforms, plus the fields you need to compare content, comments, and engagement consistently. Use it to build matched cohorts, automate alerts, and turn raw public data into a test plan you can run. Visit Captapi and see how the workflow fits into your own social analysis stack.