
8 Brand Engagement Metrics to Track in 2026

Likes are the easiest brand engagement metric to report, and one of the easiest to misread. A post can attract intense interaction because it's funny, controversial, or useful to a narrow audience, while doing little to strengthen recall, generate qualified visits, or influence purchase intent. Engagement is evidence of activity, not proof of business impact.
A useful measurement system follows the audience through five questions: Who saw the brand? Who paid attention? What did they say? What did they do next? Is the brand gaining ground against alternatives? The eight metrics below map to those questions, from exposure and interaction to conversation, response, growth, and competitive momentum. The formulas matter, but so do the definitions behind them. Teams should document the platform, content type, audience denominator, reporting window, source filters, and comparison group before interpreting a change.
Table of Contents
- 1. Engagement Rate
- 2. Comment Volume and Sentiment Analysis
- 3. Share of Voice
- 4. Click-Through Rate and Traffic Attribution
- 5. Audience Growth Rate and Follower Acquisition Cost
- 6. Video Completion Rate and Average View Duration
- 7. Reach and Impressions
- 8. Brand Mention Velocity and Hashtag Performance
- 8-Point Brand Engagement Metrics Comparison
- Build a Measurement Loop, Not a Scoreboard
1. Engagement Rate
Engagement rate measures interaction relative to a defined audience, not overall brand performance. Use the formula that matches the question:
Engagement rate = total interactions ÷ reach, impressions, views, or followers × 100
A reach-based rate shows how many people who saw a post interacted. A follower-based rate supports steadier account comparisons when reach is unavailable. A view-based rate fits video, while an impression-based rate accounts for repeated exposure. Hootsuite's engagement rate formulas and benchmarks outlines these alternatives and platform-dependent actions, including likes, comments, shares, saves, and clicks.
Platform definitions can produce materially different results. A 2026 benchmark report counts likes, comments, favorites, reposts, shares, reactions, and video interactions, then divides total interactions by follower count. Its reported TikTok rate was 2.01%, while X rose from 0.015% in 2024 to 0.03% in 2025. These figures describe that source's methodology, so they should not be compared with a reach-based rate from another dashboard. The 2026 social media benchmark report provides the relevant definitions.
Practical rule: Report the denominator, interaction set, platform, content type, and reporting window with every rate.
Diagnose the rate with its components
A high rate alongside low reach can indicate strong resonance within a limited audience. High reach with weak interaction points to distribution without sufficient relevance. Combine the rate with shares, saves, comments, click-through rate, and sentiment to separate passive reactions from deeper attention or intent.
Calculation consistency matters across platforms. Captapi's engagement rate calculator can help standardize inputs, while its public data endpoints expose engagement fields for supported platforms. Comparisons with high-end short-form brand videos from ImageStudio are meaningful only when the formula, interaction rules, audience denominator, and content filters match.
2. Comment Volume and Sentiment Analysis
A comment count tells you that a post prompted conversation. It doesn't tell you whether the conversation contains praise, confusion, objections, questions, spam, or requests for help. That's why comment volume and sentiment should be read as a pair.
The basic formulas are straightforward:
- Comment volume = total qualifying comments during the reporting window
- Positive sentiment share = positive comments ÷ analyzed comments × 100
- Negative sentiment share = negative comments ÷ analyzed comments × 100
The sentiment categories must be defined before analysis. A neutral comment can contain valuable information, such as a product question or a comparison with a competitor. Sarcasm, mixed sentiment, duplicate comments, bots, and replies from the brand can also distort an automated classification. A team should preserve the raw comment, classification, confidence or review status, language, platform, and post identifier.
Volume is a signal, not a verdict
High volume with positive sentiment can indicate useful resonance or an active community. High volume with negative sentiment may indicate a product issue, a controversial claim, or a campaign that reached people outside the intended audience. Low volume with neutral questions may signal weak distribution, unclear positioning, or a topic that needs stronger prompts.
This metric becomes more diagnostic when segmented by post format, audience source, topic, and commenter type. A verified expert, existing customer, or repeat contributor may provide more actionable feedback than a low-context reaction. Don't erase critical comments from the dataset. Exclude spam for trend reporting, but retain it in a separate moderation view.
Captapi's social sentiment analysis guide is relevant for teams building automated comment workflows. A practical pipeline can extract comments, deduplicate them, classify sentiment, summarize recurring themes, and route urgent topics for human review. The output should answer a business question, such as whether a launch created understanding, whether customers are requesting a feature, or whether a creator partnership attracted the wrong audience.
3. Share of Voice
Share of voice, or SOV, measures a brand's proportion of a defined conversation set. The common formula is:
SOV = brand mentions ÷ total brand and competitor mentions × 100
The calculation is only meaningful if the listening universe is explicit. Define the category keywords, branded terms, misspellings, hashtags, languages, platforms, date range, and competitor set. Separate brand-led mentions from generic category discussion, because a brand can dominate its own hashtag while remaining marginal in the broader market conversation.
SOV also measures visibility, not preference. A scandal can increase mentions and therefore raise SOV without improving trust. A competitor's campaign can inflate the total conversation and make your percentage fall even if your absolute mention count stays stable. Report both the share and the underlying volume.
Turn SOV into a competitive diagnostic
Break the measure down by platform and narrative. A brand might lead on YouTube because it owns educational search demand, yet trail on TikTok where creators shape discovery. It might also have strong product mentions but weak service mentions, or high awareness among professionals and limited consumer discussion.
Useful companion measures include:
- Positive SOV, the brand's share of positive mentions
- Narrative SOV, the brand's share within a specific topic
- SOV by format, separating video, posts, comments, and news-like discussion
- SOV change, comparing the current period with a consistently defined prior window
A team monitoring a product launch should inspect SOV spikes alongside sentiment, reach, click-through rate, and branded search activity. A rise in conversation without corresponding action may reflect attention rather than demand.
Captapi's competitor analysis and benchmarking guidance can help structure a cross-platform collection process. Use the same query logic for every brand, maintain a change log when terms are added or removed, and review false positives manually. The most valuable conclusion isn't “we gained share.” It's “we gained share in the narrative that matters to the next commercial decision.”
4. Click-Through Rate and Traffic Attribution
Click-through rate measures whether exposure and attention become a measurable visit or response. The core formula is:
CTR = tracked clicks ÷ impressions or viewers × 100
Some teams also calculate click-to-visit rate, which compares analytics sessions with recorded clicks. That distinction matters because blocked tracking, redirects, duplicate clicks, and platform reporting differences can create gaps between the two systems.
CTR is most useful when the destination and action are clear. A post linking to a product page should be evaluated differently from a video asking viewers to read an educational article. Use unique URLs or UTM parameters for each platform, campaign, creator, and placement. Keep the attribution window consistent, and separate organic, paid, referral, and direct traffic where the analytics system allows it.
Pair response with downstream quality
High CTR with short sessions or rapid exits can indicate a compelling promise and a poor landing-page match. Low CTR with strong comments and saves may mean the content is valuable but the call to action is weak or poorly placed. High traffic with few sign-ups can point to audience mismatch, offer friction, or a measurement failure.
For video, inspect the transcript and placement of the call to action. A creator may mention the link before explaining the problem, while a product team may place the clearest value proposition in a pinned comment. Neither approach should be judged from CTR alone. Compare CTR, landing-page engagement, form completion, qualified leads, and assisted conversions.
Captapi's performance attribution resource can support a workflow that connects public video and transcript data with campaign-level tracking. Don't infer competitor CTR from public engagement data. You can study their messaging, placement, and visible interaction patterns, but private click data requires your own analytics or an authorized reporting source.
5. Audience Growth Rate and Follower Acquisition Cost
Audience growth rate shows whether the addressable community is expanding. A simple formula is:
Audience growth rate = net new followers ÷ followers at the start of the period × 100
Net new followers should account for follows and unfollows during the same window. Report the period, platform, and whether the figure includes paid acquisition. A short spike may come from a viral post, a promotion, or a creator mention, while sustained growth suggests a more repeatable discovery mechanism.
Follower acquisition cost adds efficiency:
Follower acquisition cost = attributable spend ÷ net new followers
Use only spend that was intended to acquire or influence followers, and label the result carefully when a campaign also generated awareness, clicks, or leads. A low cost can be misleading if the acquired audience doesn't engage or convert. A higher cost can be rational when the audience has strong relevance and downstream value.
A growing audience isn't necessarily a healthier audience. Growth needs a quality check.
Split growth before making a budget decision
Separate organic growth, paid growth, creator-driven growth, and campaign-driven growth. Then compare each source with engagement rate, comment sentiment, reach, and site actions. A channel that gains followers while interaction falls may be accumulating poorly matched users. A smaller acquisition stream with stronger retention and response may deserve more investment.
The brief's suggested follower-cost benchmark for SaaS isn't supported by the verified evidence provided here, so it shouldn't be presented as a universal target. Instead, establish a baseline from your own campaigns and compare like with like. Keep creative, audience, geography, objective, and attribution rules stable enough for the comparison to mean something.
6. Video Completion Rate and Average View Duration
Video retention reveals whether viewers stayed long enough to receive the message. The formulas are:
Completion rate = completed views ÷ video starts or views × 100
Average view duration = total watch time ÷ total views
Platforms define a view and a completion differently, so record the source definition. Average view duration is often more informative than completion rate for long-form content, while completion rate can be useful for short clips. Neither metric proves comprehension. A viewer may finish a video while distracted, or leave because the answer arrived early.
Read the retention curve, not only the average
A sharp opening drop can indicate a weak hook, an unclear promise, slow branding, or a mismatch between thumbnail and content. A later drop may show that the explanation became repetitive or that the call to action interrupted the viewer's goal. Compare curves by topic, format, length, traffic source, and new versus returning audience.
Use retention with interaction and action metrics. High completion with few comments or clicks may mean the video entertained but didn't move the audience toward the intended response. Strong completion and strong saves may signal educational value. Strong completion alongside negative sentiment can reveal a message that held attention for the wrong reason.
Captapi can help teams inspect public video structure through transcripts and summaries, but public competitor data shouldn't be treated as private retention analytics. The embedded video below can be used as a qualitative reference for reviewing pacing, structure, and calls to action.
Set a baseline by content series rather than importing a generic completion target. Topic complexity, viewer intent, editing style, and distribution source all affect retention. A tutorial and a short announcement shouldn't share the same threshold.
7. Reach and Impressions
Reach measures unique accounts exposed to content. Impressions count total displays, including repeat exposure. The formulas are simple counts:
Reach = number of unique accounts reached
Impressions = total displays
The distinction becomes useful through the ratio:
Frequency = impressions ÷ reach
A high frequency can support recall, but it can also indicate audience saturation. A low frequency with weak engagement may mean the content is being distributed broadly without enough repetition or relevance. Treat platform-reported reach as platform-specific. Network definitions, deduplication rules, privacy controls, and reporting windows can prevent a clean one-to-one comparison.
Use exposure to explain interaction
Reach answers whether distribution occurred. Engagement rate answers whether exposed users responded. Together, they separate content that is widely seen and weakly received from content that is narrowly distributed and highly resonant. Add CTR to identify exposure that becomes traffic, and sentiment to identify exposure that creates a harmful or positive conversation.
Segment reach by discovery source, such as search, recommendations, subscriptions, paid distribution, or shares. A post with high recommendation reach may have broad algorithmic distribution, while search reach can indicate durable intent. For competitor analysis, public views may act as an observable proxy for exposure, but they shouldn't be relabeled as unique reach.
Use the following funnel as a reporting aid. It should connect visibility to interaction and action without implying that every audience member moves through each stage.
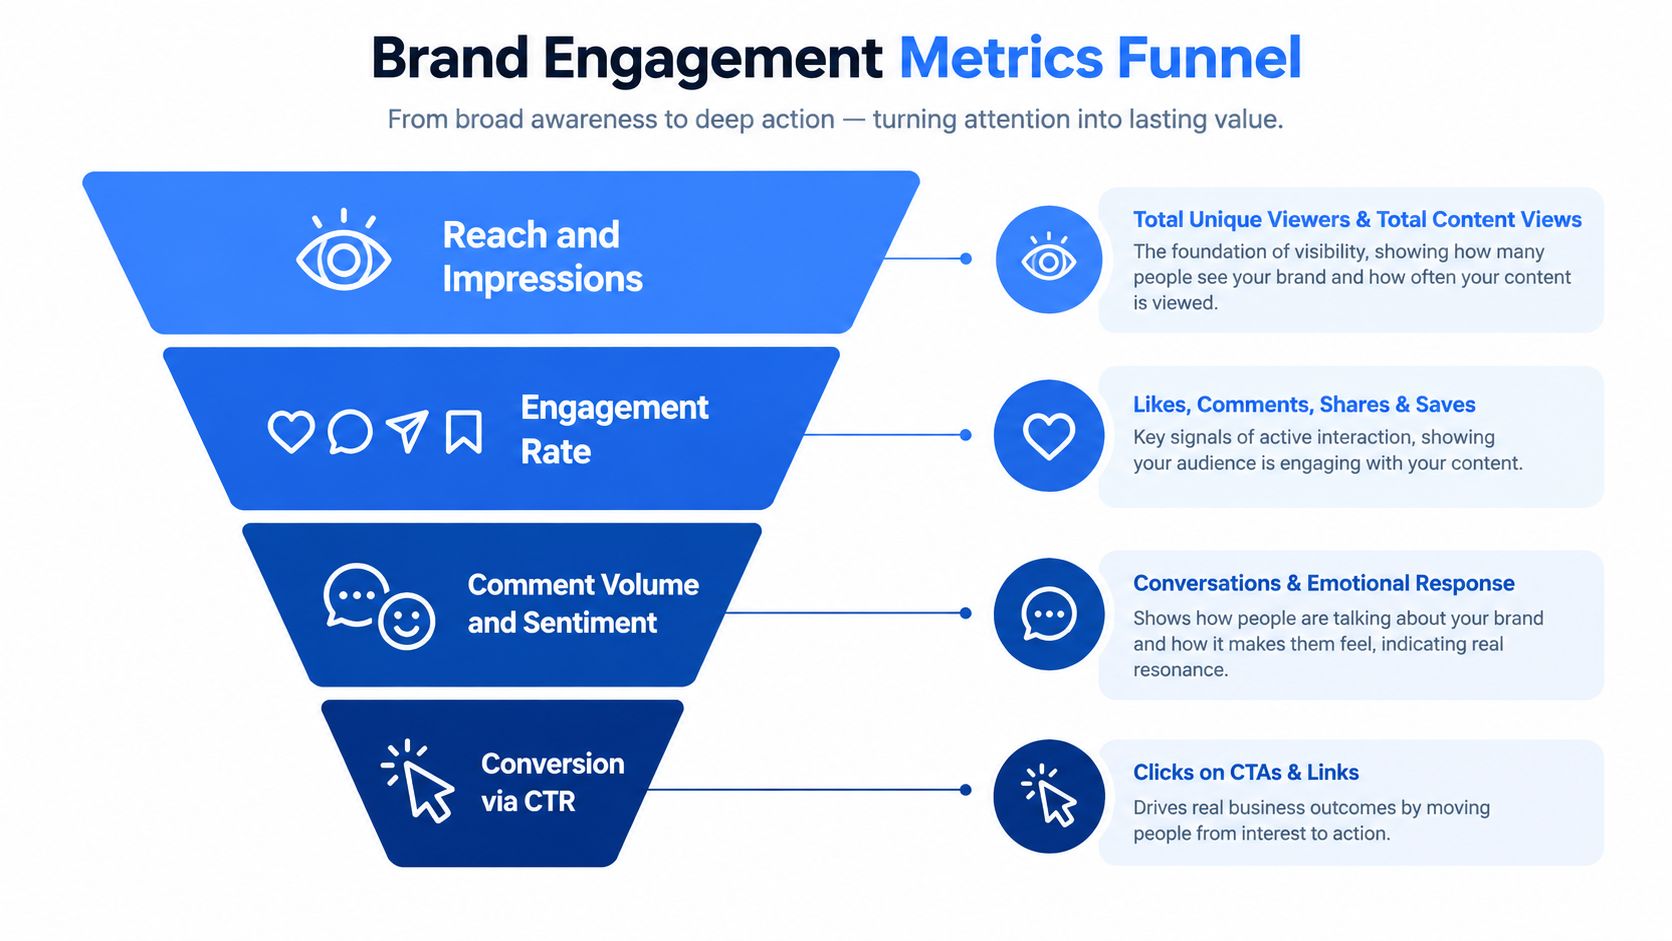
A further warning comes from benchmark design. A 2026 benchmark based on 70 million posts reported TikTok at 3.70%, Instagram at 0.48%, Facebook at 0.15%, and X at 0.12%. It also reported that brands published an average of 5 posts per week on both Instagram and TikTok. These are not reach benchmarks, but they show why exposure and interaction must be interpreted within a platform and publishing context. The Socialinsider benchmark dataset provides that methodology.
8. Brand Mention Velocity and Hashtag Performance
Mention velocity measures how quickly brand references accumulate or decline:
Mention velocity = new mentions ÷ time period
For trend comparison, keep the interval fixed and report both the current velocity and the change from a comparable prior window. A spike can indicate a launch, news event, creator post, complaint, or viral discussion. The number becomes useful only after classification.
Hashtag performance is not one metric. Calculate it according to the purpose:
- Hashtag reach = reach attributed to posts using the hashtag
- Hashtag engagement rate = interactions on hashtagged posts ÷ reach or followers × 100
- User-generated content volume = qualifying public posts using the branded hashtag
A hashtag can generate visibility without attracting relevant users. It can also be used frequently in posts that perform poorly. Compare hashtags within the same platform, format, audience, and campaign objective instead of declaring one tag universally effective.
Separate momentum from noise
Monitor brand mentions alongside sentiment, SOV, reach, engagement quality, and CTR. A sudden rise in mentions with negative sentiment requires a response workflow, not a celebratory report. A rise in branded hashtag use with more saves and qualified visits suggests stronger discoverability and intent. A competitor's velocity spike can reveal a campaign before its broader market effect becomes visible.
Captapi's TikTok hashtag trends resource can inform a search and monitoring workflow. Use consistent query variants, exclude irrelevant meanings, and archive snapshots so deleted or edited posts don't erase the history. The best alert is not just “mentions increased.” It identifies which narrative changed, who amplified it, where it spread, and whether the audience took a valuable next action.
8-Point Brand Engagement Metrics Comparison
| Metric | Implementation Complexity 🔄 | Resource Requirements ⚡ | Expected Outcomes 📊 | Ideal Use Cases 💡 | Key Advantages ⭐ |
|---|---|---|---|---|---|
| Engagement Rate | Medium 🔄🔄 | Low–Medium ⚡⚡ | Clear signal of content resonance and comparability | Benchmarking, content optimization, campaign tracking | ⭐⭐⭐ Normalized across audience sizes; actionable for optimization |
| Comment Volume & Sentiment Analysis | High 🔄🔄🔄 | High ⚡⚡⚡ | Qualitative audience opinion, real-time issue detection | Customer feedback, PR monitoring, trend analysis | ⭐⭐⭐⭐ Reveals sentiment and conversational context |
| Share of Voice (SOV) | Medium–High 🔄🔄🔄 | Medium ⚡⚡ | Competitive visibility and market positioning trends | Competitive benchmarking, market positioning assessment | ⭐⭐⭐ Quantifies brand prominence vs. competitors |
| CTR & Traffic Attribution | Medium 🔄🔄 | Medium ⚡⚡ | Direct conversion signals and revenue impact | Conversion optimization, CTA testing, funnel analysis | ⭐⭐⭐⭐ Tied to business outcomes and ROI |
| Audience Growth Rate & FAC | Low–Medium 🔄🔄 | Medium ⚡⚡ | Efficiency of follower acquisition; cost-per-follower insights | Growth strategy, budget allocation, channel valuation | ⭐⭐⭐ Measures marketing efficiency; simple to interpret |
| Video Completion Rate & Avg View Duration | Medium 🔄🔄 | Medium ⚡⚡ | Content quality and retention insights; optimization points | Video optimization, pacing/hooks testing, YouTube growth | ⭐⭐⭐ Directly reflects viewer satisfaction and retention |
| Reach & Impressions | Low 🔄 | Low–Medium ⚡⚡ | Awareness baseline and input for engagement calculations | Awareness measurement, channel prioritization, virality checks | ⭐⭐ Foundational metric for visibility and benchmarking |
| Brand Mention Velocity & Hashtag Performance | High 🔄🔄🔄 | High ⚡⚡⚡ | Early trend detection and discoverability performance | PR monitoring, trend spotting, hashtag strategy | ⭐⭐⭐⭐ Early warning for viral/PR events; guides hashtag use |
Build a Measurement Loop, Not a Scoreboard
Eight metrics become useful when they operate as a connected system. Start by defining the audience, category, competitor set, platforms, content types, and business outcome. Then document each formula, denominator, interaction definition, attribution window, timezone, and source filter. Without that metadata, a dashboard can produce precise-looking numbers that aren't comparable.
Collect exposure first. Reach and impressions show distribution, while frequency reveals whether the same audience saw the message repeatedly. Add engagement rate to measure active response, but keep the denominator visible. A follower-based rate can support stable account comparisons, while reach-based or view-based rates may better describe a specific piece of content.
Conversation needs its own layer. Pair comment volume with sentiment and themes, then inspect SOV and mention velocity for context. A post may have high interaction because it triggered criticism. A brand may gain SOV because a crisis expanded the total number of mentions. Volume without interpretation is an alert, not an insight.
Action metrics prevent attention from becoming the final objective. Connect CTR to tracked sessions, landing-page behavior, form completion, qualified leads, registrations, or another defined outcome. Growth metrics then show whether the brand is building a durable audience, but follower acquisition cost should always be reviewed with engagement quality and downstream behavior. Finally, video completion and average view duration explain whether the audience stayed with the message long enough to receive it.
A strong dashboard pairs every leading signal with a quality check.
Use diagnostic combinations rather than isolated rankings:
- Reach plus engagement rate distinguishes distribution from resonance.
- Comment volume plus sentiment separates community interest from controversy.
- SOV plus mention velocity distinguishes stable category presence from a temporary spike.
- CTR plus landing-page behavior identifies message-to-destination fit.
- Audience growth plus engagement quality tests whether acquisition is healthy.
- Completion rate plus clicks or saves tests whether attention became useful action.
Benchmarking requires the same discipline. One 2026 benchmark based on more than one million social posts reported median rates of 3% on Instagram, 2.7% on Instagram Reels, 2% on LinkedIn, 1.8% on X, 1.5% on TikTok, and 0.8% on Facebook. The Hootsuite benchmark guidance emphasizes platform-specific interpretation. Another benchmark dataset reported materially different medians, including 4.3% for Instagram, 4.86% for TikTok, 3.6% for Facebook, 2.15% for X, and 6.5% for LinkedIn, while noting that accounts under 10K followers often see 1.5% to 6.0% engagement and accounts above 100K average 0.3% to 0.8%. The Buffer benchmark analysis shows why follower tier, format, and platform must be controlled.
The business-impact gap deserves explicit treatment. Creator-led content can outperform brand content on visible interactions and views while producing weaker unaided awareness, message association, or purchase intent than content tied more closely to the brand narrative. That evidence is discussed in Dash Social's report on shares and brand KPIs. Pair attention metrics with recall or intent measures when the objective is brand lift.
Cross-channel fragmentation creates another reporting risk. Research summarized in the Sprinklr Social Index report describes a 115-percentage-point sentiment gap between owned and earned media, with only 21% of brands characterized as highly mature and 63% in a middle tier. The implication is practical: include owned content, earned discussion, DMs, lead forms, registrations, website behavior, search interest, and revenue indicators in the measurement design where access and consent allow.
Run the loop on a fixed cadence. Define the comparison, collect the data, normalize the fields, segment the results, investigate anomalies, record the explanation, and assign a decision. Captapi is one practical option for unifying public YouTube, TikTok, Instagram, and Facebook data through a REST interface that includes comments, engagement metrics, transcripts, summaries, channel or page details, and search results. It can support a repeatable research layer, but teams remain responsible for lawful collection, appropriate use, and their own data handling.
Captapi provides one REST interface for public YouTube, TikTok, Instagram, and Facebook data, including comments, transcripts, summaries, engagement fields, and search results. Use it to build a consistent brand engagement metrics workflow, then visit Captapi to explore the API and start testing your measurement pipeline.