
Customer Engagement Metrics That Actually Drive Growth
Your social team reports a strong week. Likes are up, comments look active, and the dashboard is full of green arrows. Then the product team reports a different story: fewer customers return, support conversations increase, and churn is rising. The problem isn't that the social numbers are wrong. The problem is that they answer a narrow question, such as whether people interacted with a post, while your business needs to know whether those interactions created attention, satisfaction, adoption, retention, or revenue.
Customer engagement metrics become useful when you read them as connected signals rather than isolated scores. A like can indicate recognition, a share can suggest advocacy, and a return visit can reveal a stronger habit. None of those signals proves customer value by itself.
This guide builds the measurement system step by step. You'll learn how to separate behavioral, sentiment, outcome, and channel-specific measures, interpret social signals across YouTube, TikTok, Instagram, and Facebook, and replace raw volume with quality-weighted analysis. You'll also see how cohort-based measurement links engagement depth with retention, and how a unified API can move social data into dashboards and machine learning workflows.
If you're designing ecommerce reporting, the broader guide to KPIs for ecommerce offers useful context for connecting marketing activity with commercial outcomes. For content teams, content performance metrics helps connect individual assets to the wider customer journey.
Table of Contents
- Introduction Why Engagement Numbers Mislead Without Context
- Understanding the Four Families of Customer Engagement Metrics
- Key Social Engagement Metrics Explained and How to Read Them
- Beyond Vanity Metrics How to Measure Engagement Quality
- How to Collect Calculate and Interpret Engagement Metrics Correctly
- Putting Metrics to Work in Dashboards and ML Pipelines With Captapi
- Conclusion Your Next Steps for Measuring What Matters
Introduction Why Engagement Numbers Mislead Without Context
A marketing manager opens the morning dashboard and sees a post with high reach, plenty of likes, and a healthy stream of comments. The team promotes the result in its weekly meeting. Meanwhile, the retention report shows that the customers acquired during the campaign aren't returning at the expected rate. Product usage is shallow, support tickets mention confusion, and the customer success team is handling more preventable questions.
This situation is common because teams often treat visible activity as proof of meaningful engagement. Social platforms make interaction counts easy to access, while retention, satisfaction, and lifetime value require cleaner identity resolution and a longer observation window. The result is a dashboard that reports what happened on a channel without showing whether the experience worked across channels.
A better approach starts with four questions:
- Did customers notice us? Reach, views, impressions, and follower movement can help answer this.
- Did they pay attention? Watch time, average view duration, session duration, and meaningful interactions add depth.
- Did the experience feel useful? NPS, CSAT, customer effort score, comments, and support conversations reveal sentiment and friction.
- Did engagement create value? Activation, conversion, retention, churn, and customer lifetime value connect behavior to business outcomes.
Practical rule: A metric is only as useful as the decision it helps someone make.
The distinction matters for marketers choosing campaign goals, product teams evaluating adoption, developers building event pipelines, and executives reviewing growth quality. A unified view can also reveal when a customer sees a social post, visits a site, uses a feature, contacts support, and then returns, instead of storing each event in a separate platform report.
The rest of this guide moves from metric families to social interpretation, then to collection, calculation, dashboards, and ML pipelines. The objective isn't to find one perfect KPI. It's to build a measurement portfolio that shows frequency, depth, quality, continuity, and business impact.
Understanding the Four Families of Customer Engagement Metrics
Think of engagement measurement as a business health check. A single vital sign can alert a doctor, but it can't describe the patient's full condition. Customer engagement works the same way. A high interaction count may show activity, while sentiment and outcome measures reveal whether that activity helps the customer and the business.
A widely used framework groups customer engagement metrics into four families: behavioral, sentiment, outcome, and channel-specific measures, as described in Twilio's customer engagement measurement framework.
Behavioral metrics show what customers do
Behavioral metrics capture observable actions and usage patterns. Examples include feature usage, visit frequency, time spent in a product, active users, session duration, and meaningful event completion. They answer questions such as:
- Are customers returning?
- Which features do they use?
- How do they interact?
- Is usage occasional or habitual?
Behavioral data is often the first layer teams collect because applications, websites, and social platforms generate it automatically. Its weakness is that activity doesn't always equal value. A long session may reflect interest, confusion, or an unresolved task, so interpretation needs context.
Sentiment metrics show how customers feel
Sentiment measures include NPS, CSAT, and customer effort score. NPS uses a 0 to 10 scale and is calculated as the percentage of promoters minus the percentage of detractors, according to the NPS and engagement metric overview from Insider One. CSAT captures satisfaction with a particular interaction, while customer effort score focuses on how easy or difficult an experience felt.
These measures add meaning to behavior. A customer may use a feature frequently but report that it takes too much effort. Another may interact less often yet recommend the product strongly because each interaction solves an important problem.
Outcome metrics connect engagement to value
Outcome metrics include churn rate, activation rate, retention rate, conversion rate, and customer lifetime value. They answer the questions leaders ultimately care about:
- Did customers reach the intended outcome?
- Did they stay?
- Did they convert?
- Did the relationship become more valuable?
Outcome metrics usually require time-bounded analysis. A campaign can generate attention immediately, but its effect on retention or churn may appear later.
Channel-specific metrics add operating context
Channel-specific measures include social media interactions, email open rates, support tickets, and platform-level activity. They help teams diagnose where engagement occurs and how each channel contributes to the journey.
A portfolio view is stronger than any individual number. Social comments can expose friction, product events can show adoption, and retention can test whether the combined experience worked. The framework evolved from simple interaction counts into a broader system that connects touchpoints with satisfaction, loyalty, churn risk, and revenue.
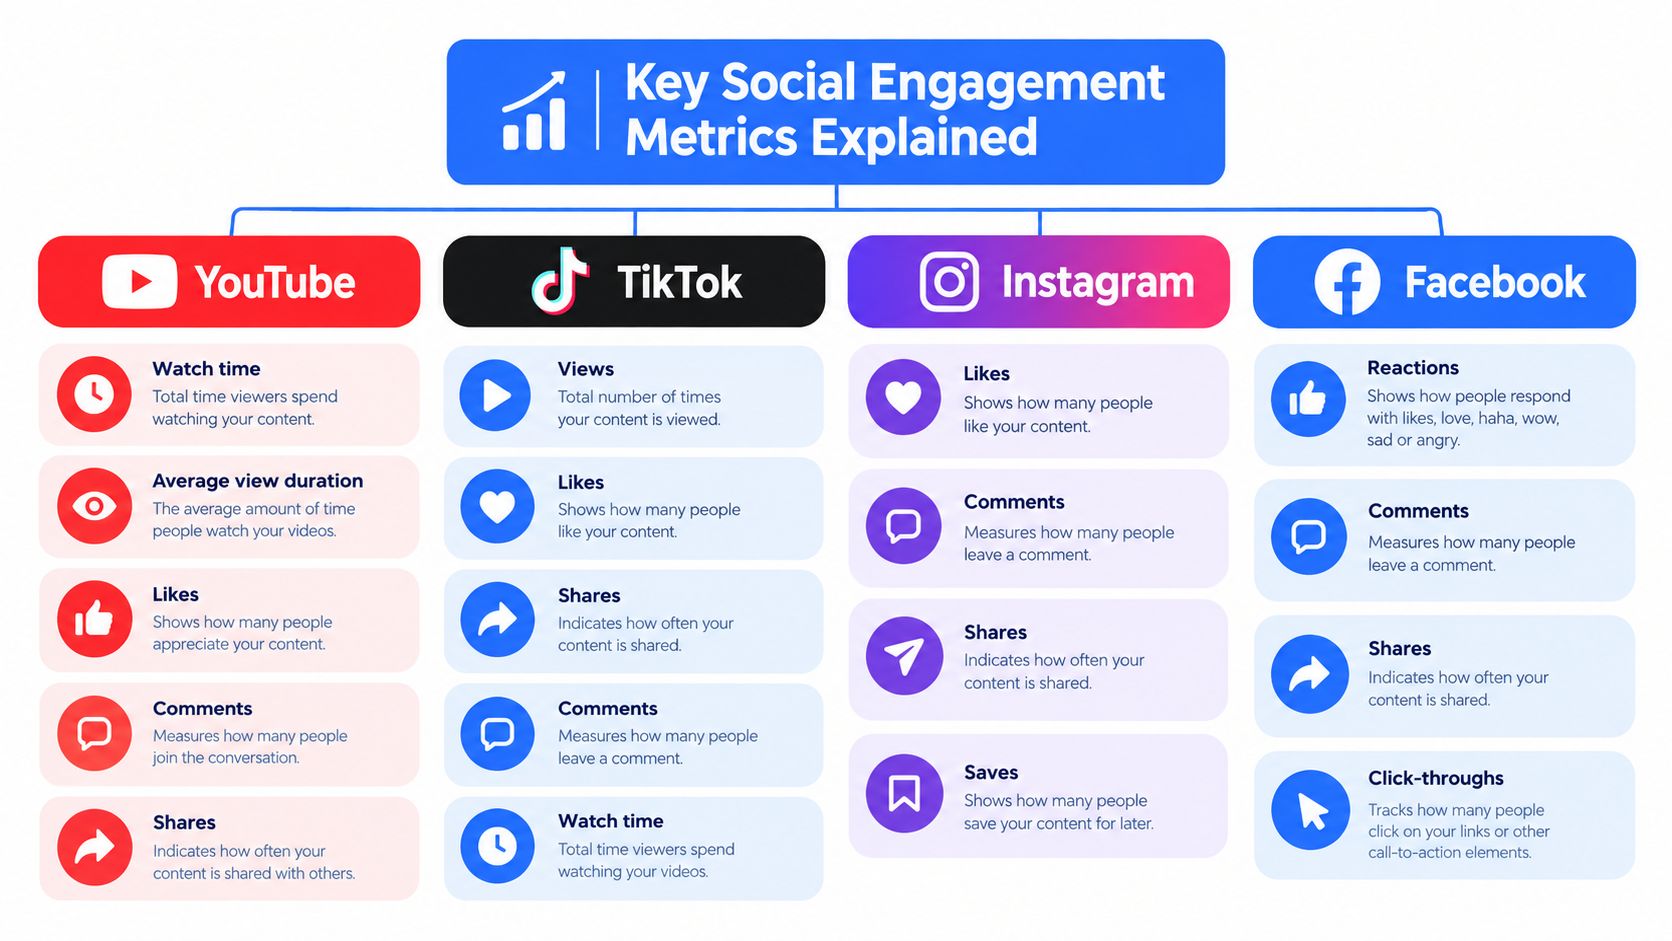
A short visual explanation of how platform signals fit into this wider model is available in this guide to social media engagement metrics.
Key Social Engagement Metrics Explained and How to Read Them
A like measures approval. A share signals advocacy or usefulness. A comment may show interest, confusion, or frustration. Reading these actions as interchangeable can send a team toward the wrong decision, so each signal needs a job, a context, and a connection to the customer journey.
Read each signal by its job
Likes and reactions are lightweight approval signals. Use them to compare creative resonance within the same platform and audience. They rarely show whether someone understood the message or took a valuable next step.
Comments provide richer context because people can explain what they need. Classify them by intent, including questions, praise, objections, technical problems, and requests for help. A post with many comments may reflect healthy community activity, or it may be drawing complaints that require a service response.
Shares and saves often indicate utility or social value. They can signal greater content depth than likes, but they still need to be connected to downstream visits, signups, purchases, or product use. A saved post may be useful later without creating immediate traffic.
Watch time and average view duration show how long video held attention. Read both with the retention curve. A sharp early drop can indicate a mismatch between the opening promise and the content. Sustained viewing suggests deeper attention, though neither measure proves satisfaction.
Click-through rate measures movement from an impression or view toward a destination. It is closer to intent than reach, but the destination experience determines whether the click becomes activation or conversion. A strong rate can therefore coexist with weak business results if the landing page creates friction.
Follower growth measures audience expansion, not customer quality. Review follower sources, repeat engagement, and retention by acquisition path before treating growth as a business result.
For a focused explanation of video attention signals, see this video engagement metrics guide.
Match the metric to the decision
| Metric | What It Measures | Best Use Case | Watch Out For |
|---|---|---|---|
| Views | Exposure and distribution | Awareness analysis | Doesn't show attention quality |
| Likes or reactions | Lightweight approval | Creative comparison | Can hide passive behavior |
| Comments | Conversation and expressed opinion | Topic and friction analysis | Volume can include complaints |
| Shares | Distribution through other users | Advocacy and usefulness | May not create qualified traffic |
| Watch time | Total attention across video consumption | Content depth | Averages can hide early drop-off |
| Average view duration | Typical video attention | Format and opening analysis | Doesn't prove satisfaction |
| Click-through rate | Movement toward a destination | Traffic and intent diagnosis | Destination friction can erase value |
| Retention curve | Attention over the content journey | Editing and content improvement | Requires consistent content comparison |
| Follower growth | Audience expansion | Awareness and community growth | Followers may not become customers |
Compare like with like. A TikTok view, an Instagram save, and a YouTube watch-time event have different platform definitions and user behaviors. Normalize event names in the warehouse while preserving the original platform fields. Then compare trends within a consistent audience, content type, and time window. A unified API can send these normalized social events into dashboards or machine-learning pipelines, reducing dependence on fragmented native tools.
Beyond Vanity Metrics How to Measure Engagement Quality
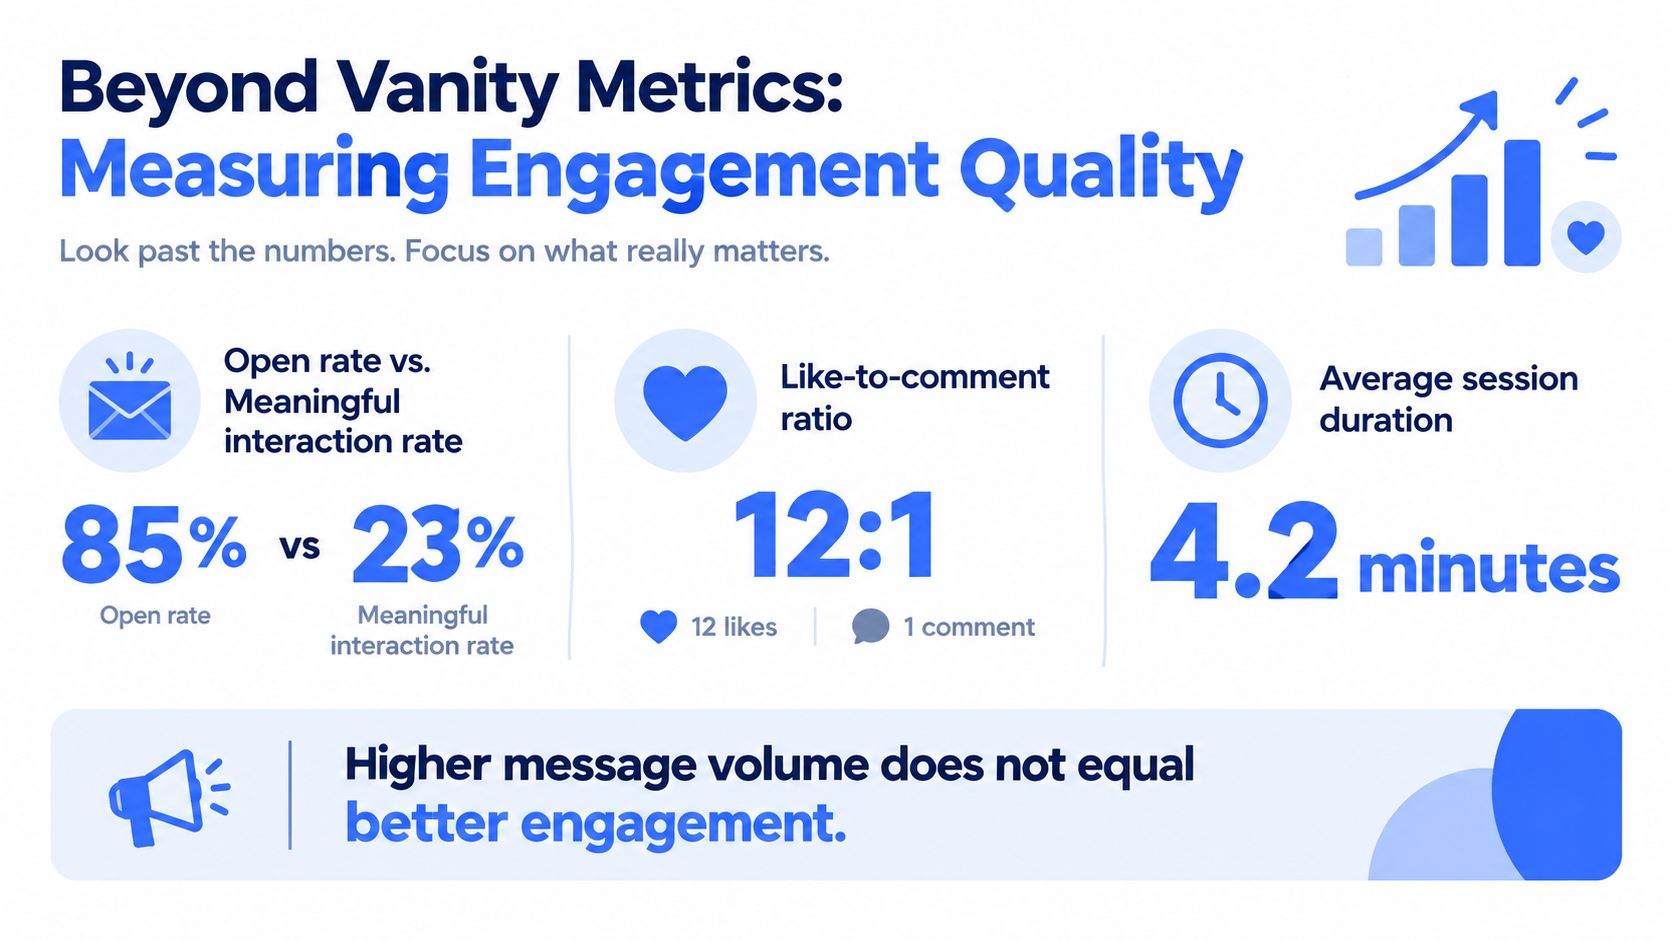
A campaign can generate a crowded stream of messages while leaving customers unsure what to do next. Repetition, conflicting calls to action, and disconnected journeys force people to reconstruct their experience across email, social, web, product, and support. Message volume is therefore a weak proxy for engagement quality.
Recent engagement research describes the scale of this measurement gap. 75% of consumers say disorganized experiences put them off, 63% of brands are stuck at developing engagement maturity, and 54% of enterprises still can't access and use real-time data, according to Emarsys customer engagement statistics. Teams may count interactions accurately yet still miss whether those interactions form a coherent experience.
Measure continuity across the journey
A quality-weighted system follows the handoff from one interaction to the next. Start with a practical scenario: a customer comments on a social post, visits a landing page, contacts support, and then uses a product feature. The measurement question is whether each step preserves context and increases the chance of a useful outcome.
Check four conditions:
- Cross-channel continuity: Can the customer move from a social post to a landing page or product experience without losing context?
- Real-time responsiveness: Does the business respond while the customer is still seeking help or showing intent?
- Disorganization friction: How often do customers repeat information, encounter contradictory messages, or receive an offer that ignores their previous action?
- Outcome progression: Does engagement move from attention to a meaningful action, such as activation, feature use, renewal, or purchase?
These checks depend on event stitching. Connect a social comment, support ticket, and product event to the same campaign, customer segment, or journey stage where possible. If identity cannot be resolved, aggregate evidence by content, cohort, or journey rather than presenting individual-level attribution as precise.
Weight meaning, not just activity
Assign greater analytical weight to events that demonstrate progress. A completed setup, successful workflow, useful support resolution, or repeat purchase may matter more than a login or passive view. Keep the weighting rules stable long enough to compare cohorts, and document why each event receives its value.
The best engagement dashboard doesn't celebrate the largest number. It explains which behaviors precede a retained, satisfied customer.
Frequency also needs a quality check. If extra touchpoints increase confusion or reduce continuity, a smaller coordinated campaign may outperform a larger one. Compare contact volume with customer effort, satisfaction, conversion, and retention. A unified API can route normalized social events into dashboards or machine-learning pipelines, so teams can evaluate these relationships without relying on fragmented native tools.
For opinion signals, social sentiment analysis helps teams categorize public feedback before connecting it with journey and outcome data.
How to Collect Calculate and Interpret Engagement Metrics Correctly
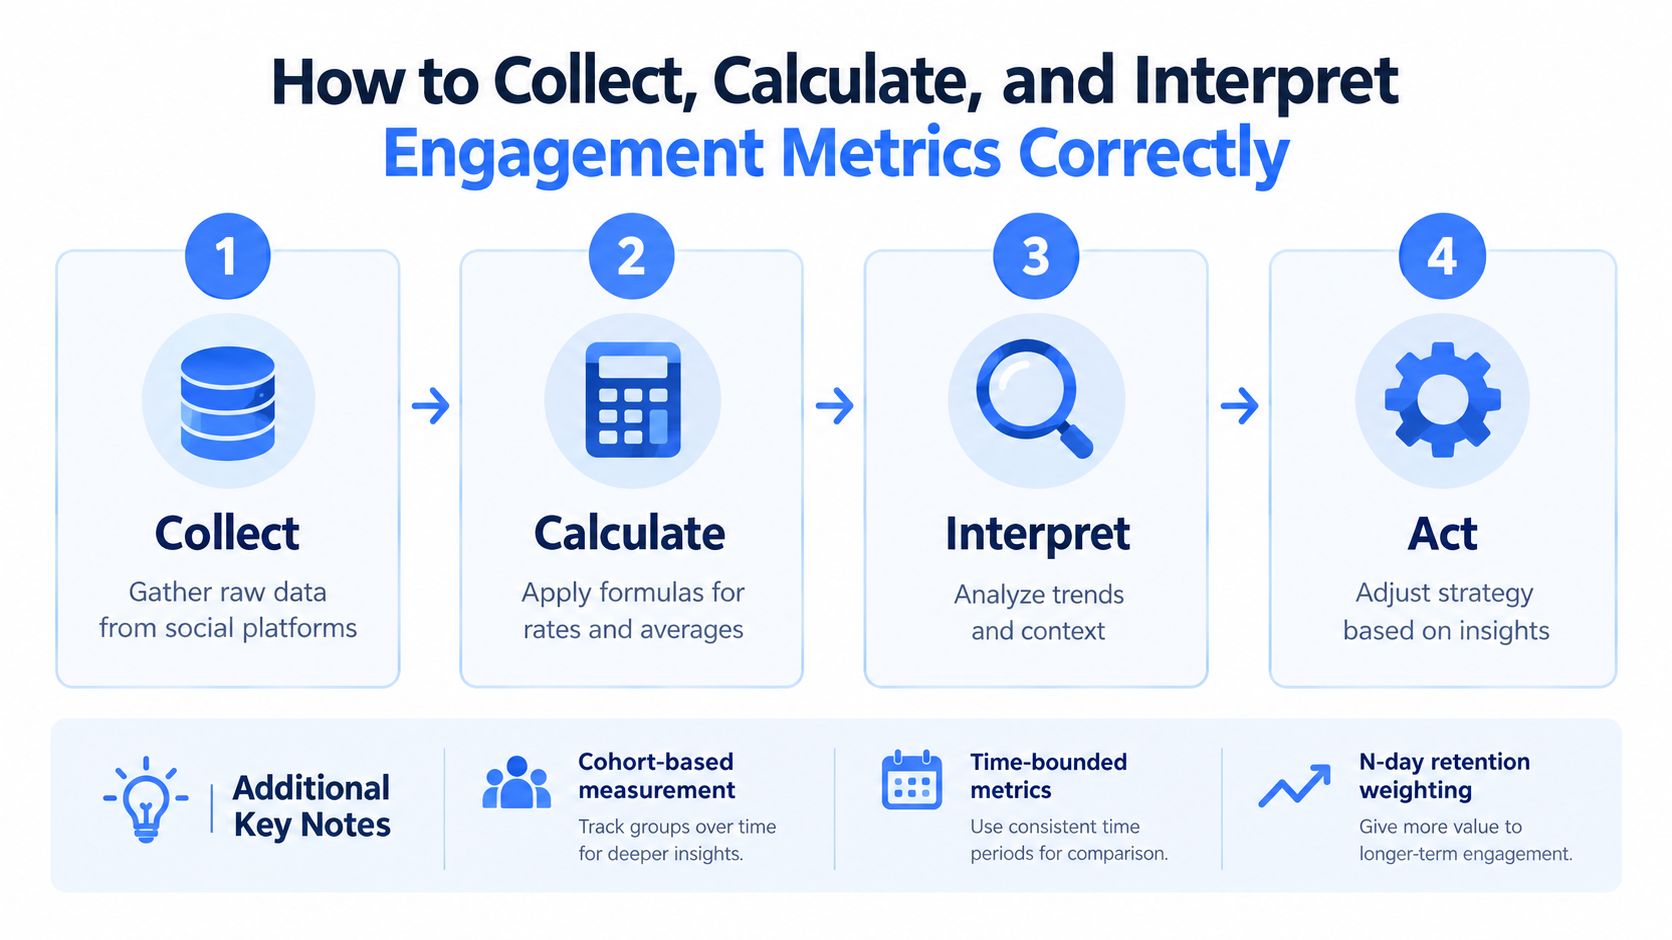
Trustworthy measurement begins with definitions, not dashboards. Before collecting data, write down what counts as a view, active user, meaningful interaction, retained customer, conversion, and churn event. Store the platform's original event name beside your normalized definition so analysts can audit differences later.
Start with a cohort and a time window
A cohort is a group that shares a meaningful starting condition, such as signup period, acquisition channel, campaign, product plan, or first feature adoption. A time-bounded view then follows that group through a defined period. This prevents a growing customer base from making engagement appear healthier because more people entered the system.
Retention analysis should connect the number of customers or revenue kept during a defined period with product-use intensity. The Gainsight retention analysis guide recommends pairing N-day retention with engagement depth. Retention tells you whether users return, while weighted significant events show how intensely retained users interact.
Normalize the ratios
Ratios make comparisons more useful, but only when the numerator and denominator share the same population and window.
- NPS: Subtract the percentage of detractors from the percentage of promoters on the 0 to 10 survey scale.
- DAU/MAU: Divide daily active users by monthly active users to estimate usage stickiness.
- Engagement rate: Define the interaction set first, then divide qualifying interactions by a consistent reach, impression, view, or audience base.
- CTR: Divide clicks by the relevant impressions, opens, or views, and label which denominator you used.
- Retention rate: Compare customers who remain at the end of the period with the eligible starting cohort, excluding newly acquired customers when appropriate.
Build a reliable collection workflow
Native platform tools are useful for quick inspection, but fragmented exports create schema, timing, and identity problems. A unified API can standardize collection across social networks, while a warehouse or event bus preserves raw responses for auditing.
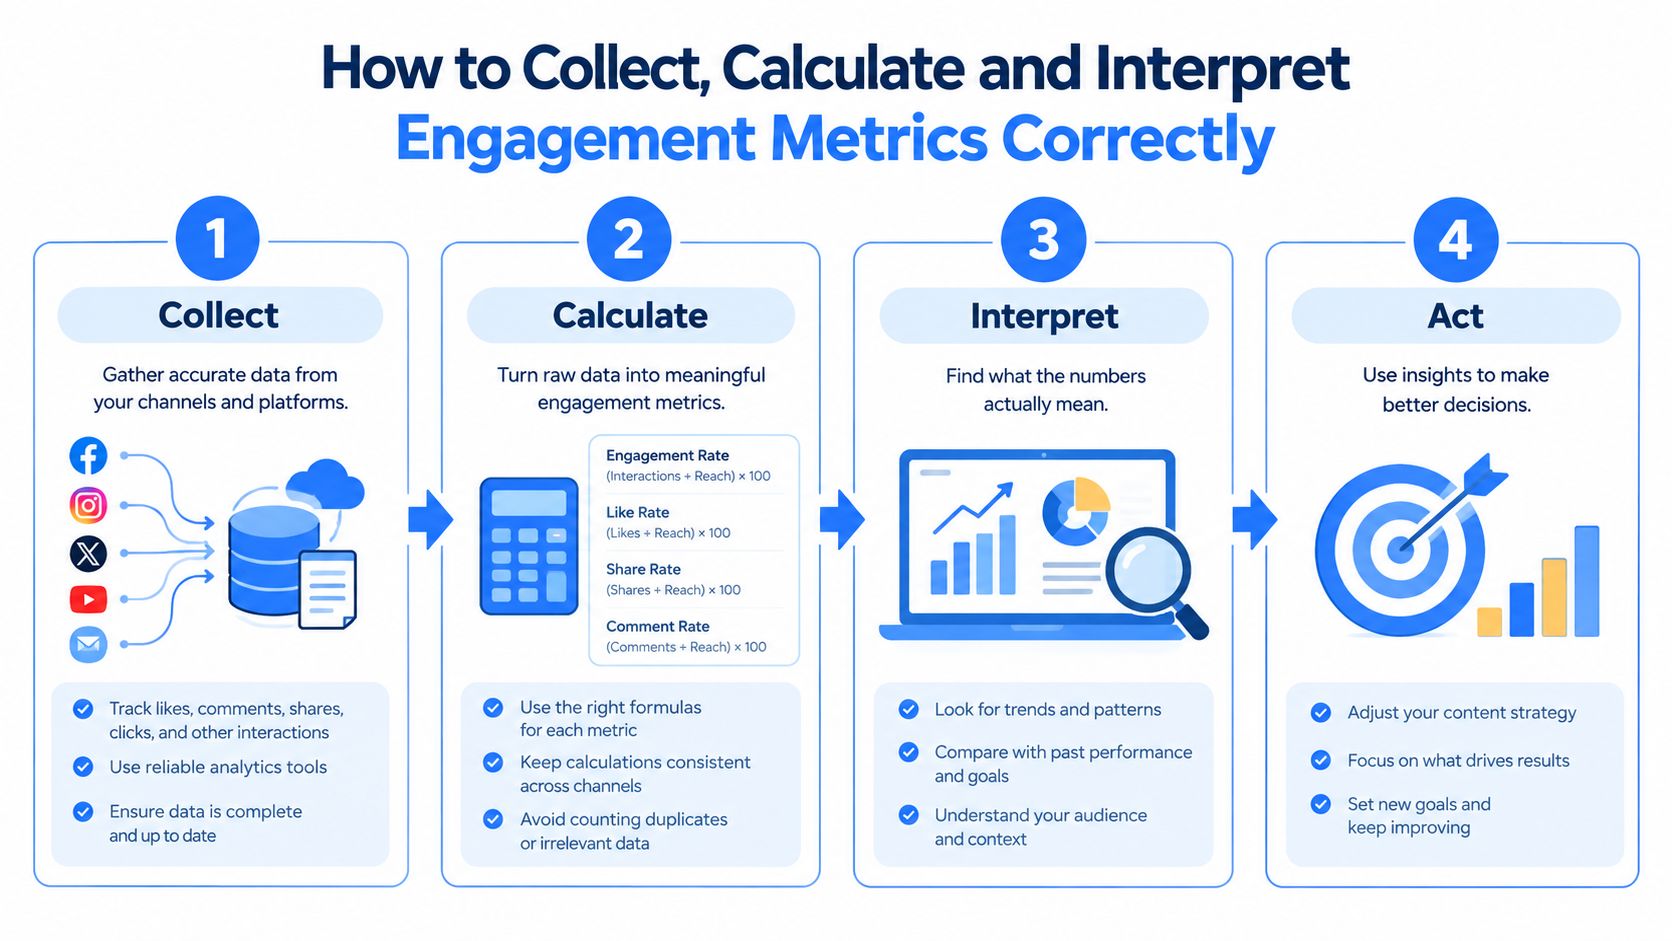
Use a repeatable pipeline:
- Collect: Capture raw metrics, content identifiers, timestamps, platform, URL, and extraction status.
- Validate: Check missing fields, duplicate records, unexpected schema changes, and delayed updates.
- Calculate: Create normalized rates and weighted depth measures from consistent populations.
- Interpret: Compare cohorts and trends, not isolated spikes.
- Act: Change content, onboarding, targeting, product experience, or support routing, then monitor the next cohort.
Cache immutable or slowly changing results, retry transient failures, and record the extraction timestamp. Data pipeline automation can help teams turn this workflow into a repeatable operating process rather than a manual reporting task.
Putting Metrics to Work in Dashboards and ML Pipelines With Captapi
A dashboard becomes useful when it joins social attention with the next customer action. A marketing view might show content views, comments, shares, saves, clicks, and conversion. A product view might connect campaign exposure to activation, feature adoption, N-day retention, and churn. A service view might combine public questions with support tickets, resolution time, CSAT, and customer effort.
Captapi provides one example of a unified collection layer. Its developer documentation describes a REST interface for public data from YouTube, TikTok, Instagram, and Facebook, with 34 endpoints covering items such as comments, engagement metrics, transcripts, summaries, channel or page details, and search results. It uses Apify-backed scrapers, retries, and a 24-hour shared cache, which can reduce repeated extraction work for the same data. Teams still need to confirm platform coverage, respect applicable rules, and take responsibility for how they store and use retrieved data.
Dashboard pattern
Create a normalized fact table with fields such as:
- Entity: Post, video, channel, page, or URL.
- Platform: The originating social network.
- Time: Publication, observation, and extraction timestamps.
- Raw signals: Views, likes, comments, shares, saves, and other available interactions.
- Derived signals: Engagement rate, interaction depth, sentiment category, and cohort-linked downstream events.
- Business context: Campaign, audience, journey stage, product, and conversion goal.
Preserve raw values, then calculate derived metrics in a controlled transformation layer. This makes it possible to revise a formula without recollecting every source record.
ML pattern
For sentiment models, export comments with content identifiers and timestamps, then label or classify them by intent. For retrieval-augmented generation, combine transcripts with metadata and engagement context so a system can retrieve not only what a video says, but which topic, audience, or content format generated deeper interaction.
A retention model can use quality-weighted events as features, but avoid leakage. Don't include actions that occur after the prediction window or outcome. Segment models by business model, because a daily-use product, a subscription service, and an ecommerce store don't define healthy engagement in the same way.
Recent reporting shows measurement priorities moving toward outcomes. 66% of marketers in one 2026 report track conversion rates as their primary success metric rather than open rates, while 73% report meaningful AI impact on messaging strategy and 28% identify improving personalization as their top priority, according to OneSignal's 2026 customer engagement report. Personalization should therefore be evaluated through conversion and retention, not engagement counts alone.
Conclusion Your Next Steps for Measuring What Matters
Customer engagement metrics work best as a connected system. Reach and views describe exposure. Comments, watch time, feature use, and session behavior describe attention and activity. NPS, CSAT, and customer effort score add customer perspective. Retention, churn, conversion, activation, and lifetime value test whether the experience created durable business value.
Start by auditing the metrics your team already reports. Mark each one as behavioral, sentiment, outcome, or channel-specific, then identify the questions it answers and the decisions it supports. Remove duplicated indicators that measure the same shallow action, and add the missing outcome or continuity signal where a dashboard currently stops at a click or like.
Use this checklist:
- Define the business outcome: Choose retention, activation, conversion, expansion, satisfaction, or another specific result.
- Select a leading signal: Pair the outcome with a behavior that could plausibly precede it.
- Create cohorts: Group customers by acquisition source, campaign, product path, or starting period.
- Set the observation window: Measure return behavior and outcome progression over a consistent period.
- Weight meaningful events: Give deeper product or customer actions more analytical importance than passive activity.
- Check journey continuity: Look for repeated questions, contradictory messages, broken handoffs, and unnecessary effort.
- Centralize social inputs: Preserve raw platform data while mapping comparable signals into a common schema.
- Operationalize the result: Send the cleaned data to dashboards, alerts, experimentation systems, or ML pipelines.
- Review decisions, not vanity spikes: Ask what changed in the customer experience after the metric moved.
Don't wait for a perfect data model. Choose one journey, one cohort definition, and a small set of leading and lagging measures. Measure consistently, investigate exceptions, and change the experience based on what retained and satisfied customers do.
Captapi gives teams a unified way to retrieve public engagement data, comments, transcripts, summaries, and platform details across major social networks through a REST interface. Visit Captapi to evaluate whether its normalized social data can support your dashboard, listening workflow, or ML pipeline.